CHAPTER 27 ⢠Statistical Process Control
CHAPTER 27 ⢠Statistical Process Control
CHAPTER 27 ⢠Statistical Process Control
You also want an ePaper? Increase the reach of your titles
YUMPU automatically turns print PDFs into web optimized ePapers that Google loves.
<strong>27</strong>-22 <strong>CHAPTER</strong> <strong>27</strong> • <strong>Statistical</strong> <strong>Process</strong> <strong>Control</strong><br />
TABLE <strong>27</strong>.4 Twenty samples of size 4, with x _ and s<br />
SAMPLE HARDNESS (KILOGRAMS) x _ s<br />
1 11.432 11.350 11.582 11.184 11.387 0.1660<br />
2 11.791 11.323 11.734 11.512 11.590 0.2149<br />
3 11.373 11.807 11.651 11.651 11.620 0.1806<br />
4 11.787 11.585 11.386 11.245 11.501 0.2364<br />
5 11.633 11.212 11.568 11.469 11.470 0.1851<br />
6 11.648 11.653 11.618 11.314 11.558 0.1636<br />
7 11.456 11.<strong>27</strong>0 11.817 11.402 11.486 0.2339<br />
8 11.394 11.754 11.867 11.003 11.504 0.3905<br />
9 11.349 11.764 11.402 12.085 11.650 0.3437<br />
10 11.478 11.761 11.907 12.091 11.809 0.2588<br />
11 11.657 12.524 11.468 10.946 11.649 0.6564<br />
12 11.820 11.872 11.829 11.344 11.716 0.2492<br />
13 12.187 11.647 11.751 12.026 11.903 0.2479<br />
14 11.478 11.222 11.609 11.<strong>27</strong>1 11.395 0.1807<br />
15 11.750 11.520 11.389 11.803 11.616 0.1947<br />
16 12.137 12.056 11.255 11.497 11.736 0.4288<br />
17 12.055 11.730 11.856 11.357 11.750 0.2939<br />
18 12.107 11.624 11.7<strong>27</strong> 12.207 11.916 0.2841<br />
19 11.933 10.658 11.708 11.<strong>27</strong>8 11.394 0.5610<br />
20 12.512 12.315 11.671 11.296 11.948 0.5641<br />
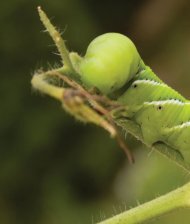
Ric Ergenbright/CORBIS<br />
<strong>27</strong>.15 Dyeing yarn. The unique colors of the cashmere sweaters your firm makes result<br />
from heating undyed yarn in a kettle with a dye liquor. The pH (acidity) of the<br />
liquor is critical for regulating dye uptake and hence the final color. There are 5<br />
kettles, all of which receive dye liquor from a common source. Twice each day, the<br />
pH of the liquor in each kettle is measured, giving samples of size 5. The process<br />
has been operating in control with 4.22 and 0.1<strong>27</strong>.<br />
(a) Give the center line and control limits for the s chart.<br />
(b) Give the center line and control limits for the x chart.<br />
<strong>27</strong>.16 Mounting-hole distances. Figure <strong>27</strong>.10 reproduces a data sheet from the floor<br />
of a factory that makes electrical meters. 8 The sheet shows measurements on the<br />
distance between two mounting holes for 18 samples of size 5. The heading informs<br />
us that the measurements are in multiples of 0.0001 inch above 0.6000 inch. That<br />
is, the first measurement, 44, stands for 0.6044 inch. All the measurements end in<br />
4. Although we don’t know why this is true, it is clear that in effect the measurements<br />
were made to the nearest 0.001 inch, not to the nearest 0.0001 inch.<br />
Calculate x and s for the first two samples. The data file contains x and s for all<br />
18 samples. Based on long experience with this process, you are keeping control<br />
charts based on 43 and 12.74. Make s and x charts for the data in Figure<br />
<strong>27</strong>.10 and describe the state of the process. MOUNTINGHOLES


