

CHAPTER 27 ⢠Statistical Process Control
CHAPTER 27 ⢠Statistical Process Control
CHAPTER 27 ⢠Statistical Process Control

You also want an ePaper? Increase the reach of your titles
YUMPU automatically turns print PDFs into web optimized ePapers that Google loves.
• Chapter <strong>27</strong> Exercises <strong>27</strong>-47<br />
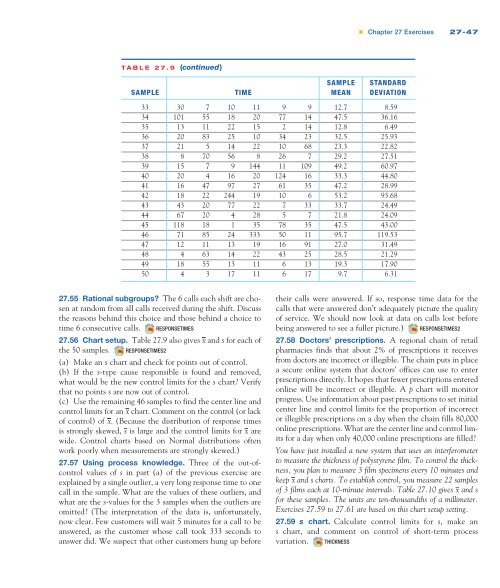
TABLE <strong>27</strong>.9 (continued)<br />
SAMPLE STANDARD<br />
SAMPLE TIME MEAN DEVIATION<br />
33 30 7 10 11 9 9 12.7 8.59<br />
34 101 55 18 20 77 14 47.5 36.16<br />
35 13 11 22 15 2 14 12.8 6.49<br />
36 20 83 25 10 34 23 32.5 25.93<br />
37 21 5 14 22 10 68 23.3 22.82<br />
38 8 70 56 8 26 7 29.2 <strong>27</strong>.51<br />
39 15 7 9 144 11 109 49.2 60.97<br />
40 20 4 16 20 124 16 33.3 44.80<br />
41 16 47 97 <strong>27</strong> 61 35 47.2 28.99<br />
42 18 22 244 19 10 6 53.2 93.68<br />
43 43 20 77 22 7 33 33.7 24.49<br />
44 67 20 4 28 5 7 21.8 24.09<br />
45 118 18 1 35 78 35 47.5 43.00<br />
46 71 85 24 333 50 11 95.7 119.53<br />
47 12 11 13 19 16 91 <strong>27</strong>.0 31.49<br />
48 4 63 14 22 43 25 28.5 21.29<br />
49 18 55 13 11 6 13 19.3 17.90<br />
50 4 3 17 11 6 17 9.7 6.31<br />
<strong>27</strong>.55 Rational subgroups? The 6 calls each shift are chosen<br />
at random from all calls received during the shift. Discuss<br />
the reasons behind this choice and those behind a choice to<br />
time 6 consecutive calls. RESPONSETIMES<br />
<strong>27</strong>.56 Chart setup. Table <strong>27</strong>.9 also gives x and s for each of<br />
the 50 samples. RESPONSETIMES2<br />
(a) Make an s chart and check for points out of control.<br />
(b) If the s-type cause responsible is found and removed,<br />
what would be the new control limits for the s chart? Verify<br />
that no points s are now out of control.<br />
(c) Use the remaining 46 samples to find the center line and<br />
control limits for an x chart. Comment on the control (or lack<br />
of control) of x. (Because the distribution of response times<br />
is strongly skewed, s is large and the control limits for x are<br />
wide. <strong>Control</strong> charts based on Normal distributions often<br />
work poorly when measurements are strongly skewed.)<br />
<strong>27</strong>.57 Using process knowledge. Three of the out-ofcontrol<br />
values of s in part (a) of the previous exercise are<br />
explained by a single outlier, a very long response time to one<br />
call in the sample. What are the values of these outliers, and<br />
what are the s-values for the 3 samples when the outliers are<br />
omitted? (The interpretation of the data is, unfortunately,<br />
now clear. Few customers will wait 5 minutes for a call to be<br />
answered, as the customer whose call took 333 seconds to<br />
answer did. We suspect that other customers hung up before<br />
their calls were answered. If so, response time data for the<br />
calls that were answered don’t adequately picture the quality<br />
of service. We should now look at data on calls lost before<br />
being answered to see a fuller picture.) RESPONSETIMES2<br />
<strong>27</strong>.58 Doctors’ prescriptions. A regional chain of retail<br />
pharmacies finds that about 2% of prescriptions it receives<br />
from doctors are incorrect or illegible. The chain puts in place<br />
a secure online system that doctors’ offices can use to enter<br />
prescriptions directly. It hopes that fewer prescriptions entered<br />
online will be incorrect or illegible. A p chart will monitor<br />
progress. Use information about past prescriptions to set initial<br />
center line and control limits for the proportion of incorrect<br />
or illegible prescriptions on a day when the chain fills 80,000<br />
online prescriptions. What are the center line and control limits<br />
for a day when only 40,000 online prescriptions are filled?<br />
You have just installed a new system that uses an interferometer<br />
to measure the thickness of polystyrene film. To control the thickness,<br />
you plan to measure 3 film specimens every 10 minutes and<br />
keep x and s charts. To establish control, you measure 22 samples<br />
of 3 films each at 10-minute intervals. Table <strong>27</strong>.10 gives x and s<br />
for these samples. The units are ten-thousandths of a millimeter.<br />
Exercises <strong>27</strong>.59 to <strong>27</strong>.61 are based on this chart setup setting.<br />
<strong>27</strong>.59 s chart. Calculate control limits for s, make an<br />
s chart, and comment on control of short-term process<br />
variation. THICKNESS


