

CHAPTER 27 ⢠Statistical Process Control
CHAPTER 27 ⢠Statistical Process Control
CHAPTER 27 ⢠Statistical Process Control

Create successful ePaper yourself
Turn your PDF publications into a flip-book with our unique Google optimized e-Paper software.
<strong>27</strong>-26 <strong>CHAPTER</strong> <strong>27</strong> • <strong>Statistical</strong> <strong>Process</strong> <strong>Control</strong><br />
to keep it in control. <strong>Control</strong> charts at the chart setup stage, on the other hand,<br />
look back in an attempt to discover the present state of the process. An example<br />
will illustrate the method.<br />
VISCOSITY<br />
EXAMPLE <strong>27</strong>.8 Viscosity of an elastomer<br />
The viscosity of a material is its resistance to flow when under stress. Viscosity is a<br />
critical characteristic of rubber and rubber-like compounds called elastomers, which<br />
have many uses in consumer products. Viscosity is measured by placing specimens<br />
of the material above and below a slowly rotating roller, squeezing the assembly, and<br />
recording the drag on the roller. Measurements are in “Mooney units,” named after the<br />
inventor of the instrument.<br />
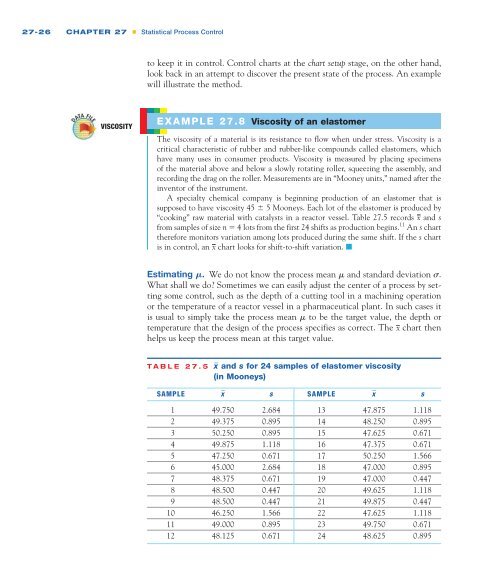
A specialty chemical company is beginning production of an elastomer that is<br />
supposed to have viscosity 45 5 Mooneys. Each lot of the elastomer is produced by<br />
“cooking” raw material with catalysts in a reactor vessel. Table <strong>27</strong>.5 records x and s<br />
from samples of size n 4 lots from the first 24 shifts as production begins. 11 An s chart<br />
therefore monitors variation among lots produced during the same shift. If the s chart<br />
is in control, an x chart looks for shift-to-shift variation. ■<br />
Estimating . We do not know the process mean and standard deviation .<br />
What shall we do? Sometimes we can easily adjust the center of a process by setting<br />
some control, such as the depth of a cutting tool in a machining operation<br />
or the temperature of a reactor vessel in a pharmaceutical plant. In such cases it<br />
is usual to simply take the process mean to be the target value, the depth or<br />
temperature that the design of the process specifies as correct. The x chart then<br />
helps us keep the process mean at this target value.<br />
TABLE <strong>27</strong>.5 x _ and s for 24 samples of elastomer viscosity<br />
(in Mooneys)<br />
SAMPLE x _ s SAMPLE x _ s<br />
1 49.750 2.684 13 47.875 1.118<br />
2 49.375 0.895 14 48.250 0.895<br />
3 50.250 0.895 15 47.625 0.671<br />
4 49.875 1.118 16 47.375 0.671<br />
5 47.250 0.671 17 50.250 1.566<br />
6 45.000 2.684 18 47.000 0.895<br />
7 48.375 0.671 19 47.000 0.447<br />
8 48.500 0.447 20 49.625 1.118<br />
9 48.500 0.447 21 49.875 0.447<br />
10 46.250 1.566 22 47.625 1.118<br />
11 49.000 0.895 23 49.750 0.671<br />
12 48.125 0.671 24 48.625 0.895


