CHAPTER 27 ⢠Statistical Process Control
CHAPTER 27 ⢠Statistical Process Control
CHAPTER 27 ⢠Statistical Process Control
Create successful ePaper yourself
Turn your PDF publications into a flip-book with our unique Google optimized e-Paper software.
<strong>27</strong>-44 <strong>CHAPTER</strong> <strong>27</strong> • <strong>Statistical</strong> <strong>Process</strong> <strong>Control</strong><br />
CHECK YOUR SKILLS<br />
<strong>27</strong>.37 A maker of auto air conditioners checks a sample of 4<br />
thermostatic controls from each hour’s production. The thermostats<br />
are set at 75F and then placed in a chamber where<br />
the temperature is raised gradually. The temperature at which<br />
the thermostat turns on the air conditioner is recorded. The<br />
process mean should be 75F. Past experience indicates<br />
that the response temperature of properly adjusted thermostats<br />
varies with 0.5F. The mean response temperature<br />
x for each hour’s sample is plotted on an x control chart. The<br />
center line for this chart is<br />
(a) 0.5F. (b) 75F. (c) 4.<br />
<strong>27</strong>.38 In Exercise <strong>27</strong>.37, the UCL for the chart is<br />
(a) 78.0F. (b) 76.5F. (c) 75.75F.<br />
<strong>27</strong>.39 In Exercise <strong>27</strong>.37 suppose the standard deviation s for<br />
each hour’s sample is plotted on an s control chart. The center<br />
line for this chart is<br />
(a) 0.5F. (b) 0.46F. (c) 0.19F.<br />
<strong>27</strong>.40 In Exercise <strong>27</strong>.37 suppose the standard deviation s for<br />
each hour’s sample is plotted on an s control chart. The LCL<br />
for this chart is<br />
(a) 0F. (b) 0.5F. (c) 1.04F.<br />
<strong>27</strong>.41 Samples of size 4 are taken from a manufacturing<br />
process every hour. A quality characteristic is measured<br />
and x and s are measured for each sample. The process<br />
is in control and after 25 samples we compute x 48.4<br />
and s 5.1. The LCL for an x control chart based on these<br />
data is<br />
(a) 48.4. (b) 33.1. (c) 31.8.<br />
<strong>27</strong>.42 A process produces rubber fan belts for automobiles.<br />
The process is in control and 100 belts are inspected each<br />
day for a period of 20 days. The proportion of nonconforming<br />
belts found over this 20-day period is p 0.12. Based on<br />
these data, a p chart for future samples of size 100 would have<br />
center line<br />
(a) 0.12. (b) 12.0. (c) 240.<br />
<strong>27</strong>.43 Referring to the previous exercise, the UCL for a p<br />
chart for future samples of size 100 would be<br />
(a) 0.22. (b) 0.15. (c) 0.12.<br />
<strong>CHAPTER</strong> <strong>27</strong><br />
EXERCISES<br />
<strong>27</strong>.44 Enlighten management. A manager who knows no<br />
statistics asks you, “What does it mean to say that a process<br />
is in control? Is being in control a guarantee that the quality<br />
of the product is good?” Answer these questions in plain<br />
language that the manager can understand.<br />
<strong>27</strong>.45 Special causes. Is each of the following examples of<br />
a special cause most likely to first result in (i) a sudden change<br />
in level on the s or R chart, (ii)<br />
a sudden change in level on the<br />
x chart, or (iii) a gradual drift<br />
up or down on the x chart? In<br />
each case, briefly explain your<br />
reasoning.<br />
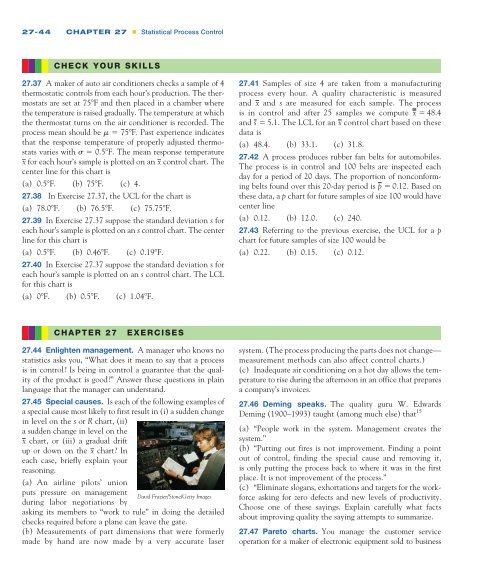
(a) An airline pilots’ union<br />
puts pressure on management<br />
David Frazier/Stone/Getty Images<br />
during labor negotiations by<br />
asking its members to “work to rule” in doing the detailed<br />
checks required before a plane can leave the gate.<br />
(b) Measurements of part dimensions that were formerly<br />
made by hand are now made by a very accurate laser<br />
system. (The process producing the parts does not change—<br />
measurement methods can also affect control charts.)<br />
(c) Inadequate air conditioning on a hot day allows the temperature<br />
to rise during the afternoon in an office that prepares<br />
a company’s invoices.<br />
<strong>27</strong>.46 Deming speaks. The quality guru W. Edwards<br />
Deming (1900–1993) taught (among much else) that 15<br />
(a) “People work in the system. Management creates the<br />
system.”<br />
(b) “Putting out fires is not improvement. Finding a point<br />
out of control, finding the special cause and removing it,<br />
is only putting the process back to where it was in the first<br />
place. It is not improvement of the process.”<br />
(c) “Eliminate slogans, exhortations and targets for the workforce<br />
asking for zero defects and new levels of productivity.<br />
Choose one of these sayings. Explain carefully what facts<br />
about improving quality the saying attempts to summarize.<br />
<strong>27</strong>.47 Pareto charts. You manage the customer service<br />
operation for a maker of electronic equipment sold to business


