Fly-tipping: Causes, Incentives and Solutions - Keep Britain Tidy
Fly-tipping: Causes, Incentives and Solutions - Keep Britain Tidy
Fly-tipping: Causes, Incentives and Solutions - Keep Britain Tidy

You also want an ePaper? Increase the reach of your titles
YUMPU automatically turns print PDFs into web optimized ePapers that Google loves.
<strong>Fly</strong>-<strong>tipping</strong>: <strong>Causes</strong>, <strong>Incentives</strong> <strong>and</strong> <strong>Solutions</strong><br />
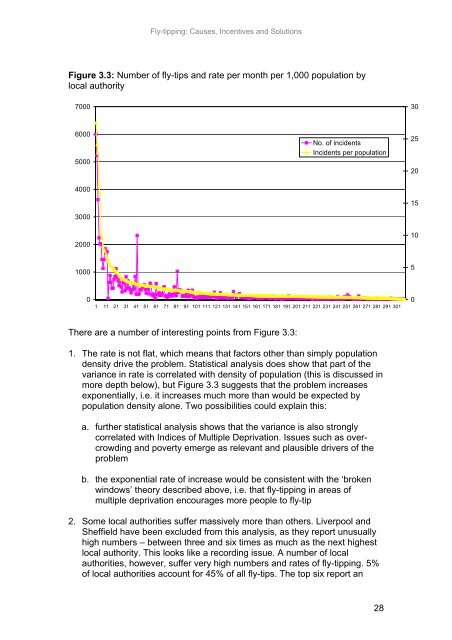
Figure 3.3: Number of fly-tips <strong>and</strong> rate per month per 1,000 population by<br />
local authority<br />
7000<br />
30<br />
6000<br />
5000<br />
4000<br />
3000<br />
No. of incidents<br />
Incidents per population<br />
25<br />
20<br />
15<br />
2000<br />
10<br />
1000<br />
5<br />
0<br />
1 11 21 31 41 51 61 71 81 91 101 111 121 131 141 151 161 171 181 191 201 211 221 231 241 251 261 271 281 291 301<br />
0<br />
There are a number of interesting points from Figure 3.3:<br />
1. The rate is not flat, which means that factors other than simply population<br />
density drive the problem. Statistical analysis does show that part of the<br />
variance in rate is correlated with density of population (this is discussed in<br />
more depth below), but Figure 3.3 suggests that the problem increases<br />
exponentially, i.e. it increases much more than would be expected by<br />
population density alone. Two possibilities could explain this:<br />
a. further statistical analysis shows that the variance is also strongly<br />
correlated with Indices of Multiple Deprivation. Issues such as overcrowding<br />
<strong>and</strong> poverty emerge as relevant <strong>and</strong> plausible drivers of the<br />
problem<br />
b. the exponential rate of increase would be consistent with the ‘broken<br />
windows’ theory described above, i.e. that fly-<strong>tipping</strong> in areas of<br />
multiple deprivation encourages more people to fly-tip<br />
2. Some local authorities suffer massively more than others. Liverpool <strong>and</strong><br />
Sheffield have been excluded from this analysis, as they report unusually<br />
high numbers – between three <strong>and</strong> six times as much as the next highest<br />
local authority. This looks like a recording issue. A number of local<br />
authorities, however, suffer very high numbers <strong>and</strong> rates of fly-<strong>tipping</strong>. 5%<br />
of local authorities account for 45% of all fly-tips. The top six report an<br />
28