Fly-tipping: Causes, Incentives and Solutions - Keep Britain Tidy
Fly-tipping: Causes, Incentives and Solutions - Keep Britain Tidy
Fly-tipping: Causes, Incentives and Solutions - Keep Britain Tidy

You also want an ePaper? Increase the reach of your titles
YUMPU automatically turns print PDFs into web optimized ePapers that Google loves.
<strong>Fly</strong>-<strong>tipping</strong>: <strong>Causes</strong>, <strong>Incentives</strong> <strong>and</strong> <strong>Solutions</strong><br />
b) details of offenders, including their criminal histories, for those<br />
convicted for the above offences in 2004. This data was extracted from<br />
the Police National Computer<br />
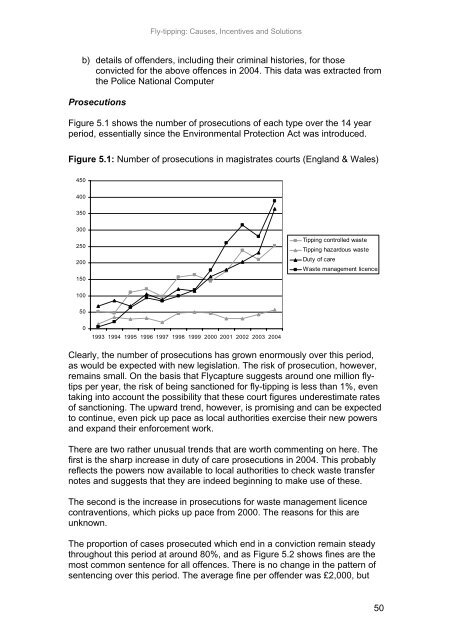
Prosecutions<br />
Figure 5.1 shows the number of prosecutions of each type over the 14 year<br />
period, essentially since the Environmental Protection Act was introduced.<br />
Figure 5.1: Number of prosecutions in magistrates courts (Engl<strong>and</strong> & Wales)<br />
450<br />
400<br />
350<br />
300<br />
250<br />
200<br />
150<br />
Tipping controlled waste<br />
Tipping hazardous waste<br />
Duty of care<br />
Waste management licence<br />
100<br />
50<br />
0<br />
1993 1994 1995 1996 1997 1998 1999 2000 2001 2002 2003 2004<br />
Clearly, the number of prosecutions has grown enormously over this period,<br />
as would be expected with new legislation. The risk of prosecution, however,<br />
remains small. On the basis that <strong>Fly</strong>capture suggests around one million flytips<br />
per year, the risk of being sanctioned for fly-<strong>tipping</strong> is less than 1%, even<br />
taking into account the possibility that these court figures underestimate rates<br />
of sanctioning. The upward trend, however, is promising <strong>and</strong> can be expected<br />
to continue, even pick up pace as local authorities exercise their new powers<br />
<strong>and</strong> exp<strong>and</strong> their enforcement work.<br />
There are two rather unusual trends that are worth commenting on here. The<br />
first is the sharp increase in duty of care prosecutions in 2004. This probably<br />
reflects the powers now available to local authorities to check waste transfer<br />
notes <strong>and</strong> suggests that they are indeed beginning to make use of these.<br />
The second is the increase in prosecutions for waste management licence<br />
contraventions, which picks up pace from 2000. The reasons for this are<br />
unknown.<br />
The proportion of cases prosecuted which end in a conviction remain steady<br />
throughout this period at around 80%, <strong>and</strong> as Figure 5.2 shows fines are the<br />
most common sentence for all offences. There is no change in the pattern of<br />
sentencing over this period. The average fine per offender was £2,000, but<br />
50