manual of methods for determining micronutrients in fortified foods
manual of methods for determining micronutrients in fortified foods
manual of methods for determining micronutrients in fortified foods

You also want an ePaper? Increase the reach of your titles
YUMPU automatically turns print PDFs into web optimized ePapers that Google loves.
VII.<br />
Interpretation<br />
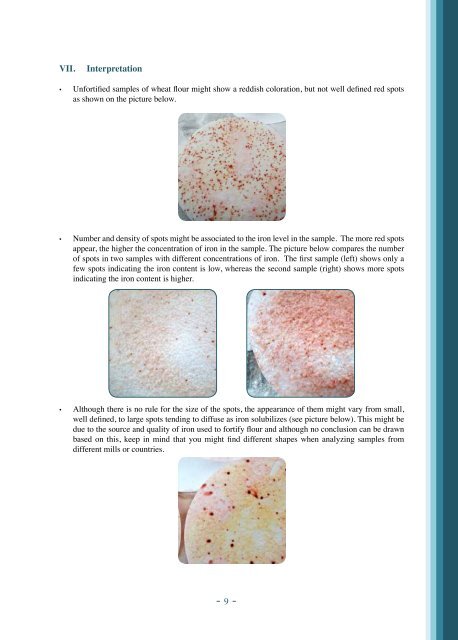
• Un<strong>for</strong>tified samples <strong>of</strong> wheat flour might show a reddish coloration, but not well def<strong>in</strong>ed red spots<br />
as shown on the picture below.<br />
• Number and density <strong>of</strong> spots might be associated to the iron level <strong>in</strong> the sample. The more red spots<br />
appear, the higher the concentration <strong>of</strong> iron <strong>in</strong> the sample. The picture below compares the number<br />
<strong>of</strong> spots <strong>in</strong> two samples with different concentrations <strong>of</strong> iron. The first sample (left) shows only a<br />
few spots <strong>in</strong>dicat<strong>in</strong>g the iron content is low, whereas the second sample (right) shows more spots<br />
<strong>in</strong>dicat<strong>in</strong>g the iron content is higher.<br />
• Although there is no rule <strong>for</strong> the size <strong>of</strong> the spots, the appearance <strong>of</strong> them might vary from small,<br />
well def<strong>in</strong>ed, to large spots tend<strong>in</strong>g to diffuse as iron solubilizes (see picture below). This might be<br />
due to the source and quality <strong>of</strong> iron used to <strong>for</strong>tify flour and although no conclusion can be drawn<br />
based on this, keep <strong>in</strong> m<strong>in</strong>d that you might f<strong>in</strong>d different shapes when analyz<strong>in</strong>g samples from<br />
different mills or countries.<br />
- 9 -