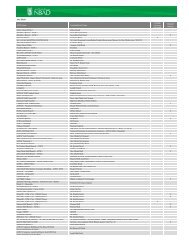
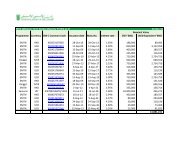
Global Trends Number <strong>of</strong> Mutual Funds by Country COUNTRY 2008 2009 2010 2011 <strong>2012</strong>Q2 World 68,978 67,933 69,890 73,033 73,731 1 Luxembourg 9,351 9,017 9,353 9,462 9,449 2 Korea, Rep. <strong>of</strong> 9,384 8,703 8,687 9,064 9,302 3 United States 8,022 7,684 7,580 7,637 7,663 4 France 8,301 7,982 7,791 7,744 7,595 5 Brazil 4,169 4,744 5,618 6,513 7,016 6 Japan 3,333 3,656 3,905 4,196 4,303 7 Ireland 3,097 2,721 2,899 3,085 3,109 8 Canada 2,015 2,075 2,117 2,655 2,799 9 Spain 2,944 2,588 2,486 2,474 2,393 10 Chile 1,484 1,691 1,912 2,150 2,221 11 Germany 1,675 2,067 2,106 2,051 2,089 12 United Kingdom 2,371 2,266 2,204 1,941 1,926 13 Belgium 1,828 1,845 1,797 1,723 1,573 14 Austria 1,065 1,016 1,016 1,003 992 15 South Africa 884 904 943 947 951 16 China 429 547 660 831 930 17 New Zealand 643 702 700 709 710 18 India 551 590 658 680 697 19 Switzerland 572 509 653 664 673 20 Italy 742 675 650 659 629 21 Liechtenstein 335 348 409 437 582 22 Taiwan 443 460 487 534 549 23 Denmark 489 483 490 500 502 24 Sweden 508 506 504 508 479 25 Mexico 431 407 434 464 474 26 Russia 528 480 462 472 466 27 Netherlands - - - 495 459 28 Norway 530 487 507 507 404 29 Finland 389 377 366 368 373 30 Turkey 304 286 311 337 347 31 Argentina 253 252 254 281 292 32 Saudi Arabia 262 244 243 249 241 33 Poland 210 208 214 226 237 34 Greece 239 210 213 196 197 35 Portugal 184 171 171 173 172 36 Hungary 270 264 276 152 160 37 Bahrain - Local 142 138 129 127 38 Pakistan 83 96 125 137 141 39 Slovenia 125 125 130 137 137 40 Bulgaria 81 85 90 92 90 41 Czech Republic 76 78 80 80 79 42 Malta - - - 59 64 43 Costa Rica 85 64 68 63 63 44 Romania 52 51 56 105 60 45 Slovakia 56 54 58 63 59 46 Philippines 43 41 43 47 48 47 Trinidad & Tobago - 36 35 36 36 Source: Investment Company Institute, Washington, DC, <strong>2012</strong>. GCC Central <strong>Bank</strong>s 36
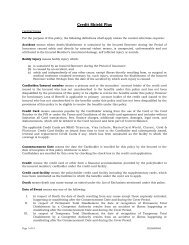
Global Trends Selected Data by Country Average Size <strong>of</strong> Fund (US$ mn) Nominal GDP (US$ mn) Market Capitalization (US$ mn) COUNTRY <strong>2012</strong>Q2 COUNTRY <strong>2012</strong> COUNTRY Jul-12 World 337 World 71,277,364 World 51,117,047 1 United States 1,590 United States 15,653,366 United States 16,718,967 2 United Kingdom 445 China 8,250,241 China 5,887,244 3 Switzerland 437 Japan 5,984,390 Japan 3,553,800 4 China 399 Germany 3,366,651 United Kingdom 3,355,275 5 Sweden 381 France 2,580,423 Canada 1,997,538 6 Ireland 366 United Kingdom 2,433,779 France 1,624,238 7 Canada 280 Brazil 2,425,052 Germany 1,518,544 8 Italy 267 Italy 1,980,448 Australia 1,323,864 9 Luxembourg 248 Russia 1,953,555 India 1,255,912 10 Mexico 221 India 1,946,765 Switzerland 1,214,570 11 Europe 210 Canada 1,770,084 Brazil 1,133,944 12 Norway 208 Australia 1,542,055 Korea, Rep. <strong>of</strong> 1,117,061 13 France 184 Spain 1,340,266 Taiwan 804,171 14 Denmark 181 Mexico 1,162,891 Russia 766,122 15 Finland 174 Korea, Rep. <strong>of</strong> 1,151,271 Sweden 561,797 16 Trinidad & Tobago 171 Turkey 783,064 Spain 536,733 17 Japan 170 Netherlands 770,224 Mexico 523,660 18 Brazil 146 Saudi Arabia 657,049 South Africa 485,683 19 Netherlands 146 Switzerland 622,855 Italy 483,145 20 India 140 Sweden 520,256 Saudi Arabia 365,477 21 Germany 139 Norway 499,827 Chile 303,597 22 South Africa 136 Belgium 476,796 Turkey 292,619 23 Taiwan 103 Argentina 474,812 Netherlands 289,744 24 Saudi Arabia 88 Poland 470,354 Belgium 289,491 25 Poland 85 Taiwan 466,054 Norway 278,017 26 Austria 81 Austria 391,469 Denmark 241,251 27 Spain 77 South Africa 390,919 Philippines 226,577 28 Philippines 62 Denmark 309,180 Poland 164,512 29 Liechtenstein 57 Chile 268,278 Finland 161,077 30 Czech Republic 54 Greece 254,978 Qatar 125,764 31 Belgium 50 Finland 247,189 Austria 107,145 32 Slovakia 48 Philippines 240,664 Ireland 107,109 33 Hungary 46 Pakistan 230,525 Portugal 67,297 34 Malta 45 Portugal 210,620 New Zealand 46,784 35 Turkey 43 Ireland 204,710 Pakistan 44,873 36 Bahrain 39 Czech Republic 193,513 Greece 39,881 37 Portugal 38 Qatar 184,566 Czech Republic 36,301 38 New Zealand 38 Romania 171,401 Argentina 26,920 39 Romania 38 New Zealand 166,923 Luxembourg 23,502 40 Argentina 30 Hungary 128,844 Hungary 20,406 41 Pakistan 27 Slovakia 91,186 Bahrain 14,075 42 Korea, Rep. <strong>of</strong> 26 Luxembourg 55,287 Romania 13,381 43 Costa Rica 25 Bulgaria 50,806 Trinidad & Tobago 11,513 44 Greece 23 Slovenia 45,421 Slovenia 5,871 45 Chile 16 Costa Rica 44,884 Slovakia 5,127 46 Slovenia 16 Bahrain 26,509 Bulgaria 5,115 47 Russia 6 Trinidad & Tobago 23,837 Malta 3,584 48 Bulgaria 3 Malta 8,415 Liechtenstein 49 Liechtenstein 4,000 Costa Rica 50 Source: Investment Company Institute, Washington, DC, <strong>2012</strong>. IMF. Reuters 37
- Page 2 and 3: Creating relationships that create
- Page 4 and 5: Broad horizon, local expertise, att
- Page 6 and 7: Dubai International Financial Centr
- Page 9 and 10: Editor / Author Gıyas Gökkent’s
- Page 11 and 12: Table of Contents Page 3 Acknowledg
- Page 13 and 14: Country Chapters 8. Bahrain 217 Eco
- Page 15 and 16: Index - Charts & Tables Chapter 1 -
- Page 17 and 18: 171 Performance of Shariah Complian
- Page 19 and 20: Chapter 9 - Egypt 242 Assets and Nu
- Page 21 and 22: Chapter 15 - United Arab Emirates 3
- Page 25 and 26: Global Trends Economic Developments
- Page 27 and 28: Global Trends Worldwide funds exper
- Page 29 and 30: Global Trends Breakdown of Global F
- Page 31 and 32: Global Trends Fiduciary Assets of S
- Page 33 and 34: Global Trends Focus: 2013 Outlook I
- Page 35 and 36: Global Trends ING IM says that the
- Page 37: Global Trends Mutual Fund Assets by
- Page 41 and 42: Global Trends notably with the UAE,
- Page 43 and 44: Global Trends investment managers o
- Page 45: MENA Region Trends
- Page 48 and 49: Middle East & North Africa In 2013,
- Page 50 and 51: Middle East & North Africa Fund Ass
- Page 52 and 53: Middle East & North Africa Number o
- Page 54 and 55: Middle East & North Africa Average
- Page 56 and 57: Middle East & North Africa d) In Du
- Page 58 and 59: Middle East & North Africa Q/ Which
- Page 60 and 61: Middle East & North Africa Trends b
- Page 62 and 63: Middle East & North Africa Equity F
- Page 64 and 65: Middle East & North Africa Fixed In
- Page 66 and 67: Middle East & North Africa curve an
- Page 68 and 69: Middle East & North Africa Focus: F
- Page 70 and 71: Middle East & North Africa 1) DFSA
- Page 73: GCC Region Trends
- Page 76 and 77: Gulf Cooperation Council Region Ind
- Page 78 and 79: Gulf Cooperation Council Region Ass
- Page 80 and 81: Gulf Cooperation Council Region Bre
- Page 82 and 83: Gulf Cooperation Council Region Ass
- Page 84 and 85: Gulf Cooperation Council Region Foc
- Page 86 and 87: Gulf Cooperation Council Region Mor
- Page 88 and 89:
Gulf Cooperation Council Region Top
- Page 90 and 91:
Gulf Cooperation Council Region Top
- Page 92 and 93:
Gulf Cooperation Council Region 201
- Page 94 and 95:
Gulf Cooperation Council Region Q/
- Page 96:
Gulf Cooperation Council Region gol
- Page 100 and 101:
Regulatory Trends with best interna
- Page 102 and 103:
Regulatory Trends Investor approach
- Page 104 and 105:
Regulatory Trends thousand Dirhams
- Page 106 and 107:
Regulatory Trends Q/ Article 4, cla
- Page 108 and 109:
Regulatory Trends Q/ In a recent ne
- Page 110 and 111:
Regulatory Trends Industry Perspect
- Page 112 and 113:
Regulatory Trends identify higher-r
- Page 114 and 115:
Regulatory Trends About Advent Soft
- Page 116 and 117:
Regulatory Trends providers and tr
- Page 118 and 119:
Regulatory Trends External Fund Ma
- Page 120 and 121:
Regulatory Trends Exempt Funds Exe
- Page 122 and 123:
Regulatory Trends All Property Fu
- Page 124 and 125:
Dubai International Financial Centr
- Page 126 and 127:
Dubai International Financial Centr
- Page 128 and 129:
Dubai International Financial Centr
- Page 130 and 131:
Dubai International Financial Centr
- Page 132 and 133:
Dubai International Financial Centr
- Page 134 and 135:
Bahrain / Kuwait Exchange Traded Fu
- Page 136 and 137:
Bahrain / Kuwait Exchange Traded Fu
- Page 138 and 139:
Bahrain / Kuwait Exchange Traded Fu
- Page 140 and 141:
Bahrain / Kuwait Exchange Traded Fu
- Page 142 and 143:
Bahrain / Kuwait Exchange Traded Fu
- Page 144 and 145:
Bahrain / Kuwait Exchange Traded Fu
- Page 146 and 147:
United Arab Emirates / Egypt Exchan
- Page 148 and 149:
United Arab Emirates / Egypt Exchan
- Page 150 and 151:
United Arab Emirates / Egypt Exchan
- Page 152 and 153:
United Arab Emirates / Egypt Exchan
- Page 154 and 155:
Oman / Saudi Arabia Exchange Traded
- Page 156 and 157:
Oman / Saudi Arabia Exchange Traded
- Page 158 and 159:
Oman / Saudi Arabia Exchange Traded
- Page 160 and 161:
Oman / Saudi Arabia Exchange Traded
- Page 163 and 164:
Benchmarks GCC Overview Money marke
- Page 165 and 166:
Benchmarks Use of hybrid benchmarks
- Page 167 and 168:
Benchmarks Recent Developments Regi
- Page 169 and 170:
Benchmarks Arabia, Tunisia and the
- Page 171 and 172:
Benchmarks In May 2010, FTSE annou
- Page 173 and 174:
Benchmarks Equity Funds Performance
- Page 175 and 176:
Benchmarks Performance of Shariah C
- Page 177 and 178:
Benchmarks Performance of Conventio
- Page 179 and 180:
Benchmarks Performance of Conventio
- Page 181 and 182:
Benchmarks Fixed Income Funds Perfo
- Page 183 and 184:
Benchmarks Industry Perspective Ami
- Page 185 and 186:
Benchmarks Q/ Which firms (local /
- Page 187:
Benchmarks On a country level we ex
- Page 192 and 193:
Sharia Compliant Funds Saudi Arabia
- Page 194 and 195:
Sharia Compliant Funds Top 5 Sharia
- Page 196 and 197:
Sharia Compliant Funds While the re
- Page 198 and 199:
Sharia Compliant Funds Fund Flows I
- Page 200 and 201:
Sharia Compliant Funds it was liqui
- Page 202 and 203:
Sharia Compliant Funds MENA Overvie
- Page 204 and 205:
Sharia Compliant Funds Average Mutu
- Page 206 and 207:
Sharia Compliant Funds Average Asse
- Page 208 and 209:
Sharia Compliant Funds and saw net
- Page 210:
Sharia Compliant Funds Top MENA Sha
- Page 214 and 215:
Exchange Traded Funds Regional Back
- Page 216:
Exchange Traded Funds MENA Focused
- Page 220 and 221:
Bahrain to register a deficit of 4.
- Page 222 and 223:
Bahrain Number of Mutual Funds (end
- Page 224 and 225:
Bahrain Average Assets of Funds (mi
- Page 226 and 227:
Bahrain Number of New Funds (end of
- Page 228 and 229:
Bahrain Fund Assets by Investor Typ
- Page 230 and 231:
Bahrain Top 10 Bahrain Domiciled Mu
- Page 232 and 233:
Bahrain Focus: Industry Perspective
- Page 234 and 235:
Bahrain CBB Rulebook Volume 6 was i
- Page 236 and 237:
Bahrain - Directory Oman Nr Company
- Page 238 and 239:
Bahrain - Directory Oman 20 Global
- Page 240:
Bahrain - Directory Oman 42 Seera I
- Page 244 and 245:
Egypt Egyptian officials to ask for
- Page 246 and 247:
Egypt Breakdown of Domestic Funds b
- Page 248 and 249:
Egypt Top 10 Egypt Domiciled Funds
- Page 250 and 251:
Egypt - Directory Oman Nr Company P
- Page 252 and 253:
Egypt - Directory Oman 21 Housing &
- Page 255 and 256:
Kuwait Economic Developments In 201
- Page 257 and 258:
Kuwait Fund Operators, Breakdown by
- Page 259 and 260:
Kuwait In 2012Q2, 86% of domestic f
- Page 261 and 262:
Kuwait In 2011, assets of mutual fu
- Page 263 and 264:
Kuwait - Directory Oman Company Pho
- Page 265 and 266:
Kuwait - Directory Oman Al-Madina f
- Page 267 and 268:
Kuwait - Directory Gulf Investment
- Page 269 and 270:
Kuwait - Directory Manafae Investme
- Page 271:
Morocco
- Page 274:
Morocco Fund Trends According to Ba
- Page 278 and 279:
Oman Overview As of June 2012, ther
- Page 280:
Oman - Directory Oman Company Phone
- Page 284 and 285:
Qatar The non-oil sector will act a
- Page 286 and 287:
Qatar Qatar Central Bank publishes
- Page 288 and 289:
Qatar Breakdown of Investments Unde
- Page 290 and 291:
Qatar Focus: Recent developments in
- Page 292 and 293:
Qatar business. In 2012, over 60% o
- Page 294 and 295:
Qatar Count QFC # Firm Name License
- Page 296 and 297:
Qatar Investment Funds Licensed in
- Page 298 and 299:
Qatar Directory of Investment Compa
- Page 300:
Qatar - Directory Oman Investment H
- Page 304 and 305:
Saudi Arabia property. Banks previo
- Page 306 and 307:
Saudi Arabia Fund Industry Breakdow
- Page 308 and 309:
Saudi Arabia In 2011, the top 5 fir
- Page 310 and 311:
Saudi Arabia New Funds in 2011 Fund
- Page 312 and 313:
Saudi Arabia Number of New Funds by
- Page 314 and 315:
Saudi Arabia Number of Subscribers
- Page 316 and 317:
Saudi Arabia SAMA data indicate tha
- Page 318 and 319:
Saudi Arabia At the end of 2012Q3,
- Page 320 and 321:
Saudi Arabia Top 10 Saudi Domiciled
- Page 322 and 323:
Saudi Arabia Fund Assets in Tadawul
- Page 324 and 325:
Saudi Arabia - Directory Oman Compa
- Page 326 and 327:
Saudi Arabia - Directory Oman Jadwa
- Page 331 and 332:
United Arab Emirates Economic Devel
- Page 333 and 334:
United Arab Emirates Top Local Fund
- Page 335 and 336:
United Arab Emirates Breakdown of F
- Page 337 and 338:
United Arab Emirates Recent Fund La
- Page 339 and 340:
United Arab Emirates Fund Managers
- Page 341 and 342:
United Arab Emirates The first succ
- Page 343 and 344:
United Arab Emirates Top 10 UAE Dom
- Page 345 and 346:
United Arab Emirates - Directory Om
- Page 347 and 348:
United Arab Emirates - Directory Om
- Page 349:
ONE PLACE DIVERSIFYING Qatar. Where