- Page 1 and 2: 17th International Symposium on Ice
- Page 3 and 4: 3 3 2 2 n = ⎜ ⎛ n + ⎟ ⎞ ice
- Page 5 and 6: of continuous calculation [13-15] o
- Page 7 and 8: component (17) satisfy the uniform
- Page 9: a) b) Fig. 2. 2D-numerical simulati
- Page 13 and 14: 17th International Symposium on Ice
- Page 15 and 16: To represent soil-vegetation-atmosp
- Page 17 and 18: altitude, because no suitable metho
- Page 19 and 20: simulated. Daily Lena River runoff
- Page 21 and 22: egion of city Lensk as an example.
- Page 23 and 24: The outcomes of accounts under the
- Page 25 and 26: The simulation of an actual high wa
- Page 27 and 28: The conducted researches have allow
- Page 29 and 30: of a man-caused catastrophe. A numb
- Page 31 and 32: simplicity there were acknowledged
- Page 33 and 34: e periodically clarified (ideally -
- Page 35 and 36: Γ 1 1 ¦З M * Γ 4 ЈЁaЈ © D
- Page 37 and 38: open-water width; t i = initial ice
- Page 39 and 40: Similarly, the governing equations
- Page 41 and 42: 17th International Symposium on Ice
- Page 43 and 44: ANALYSIS TARGETS AND NON-STATIONARY
- Page 45 and 46: asic spans, the base spans with sim
- Page 47 and 48: exponential distribution. The numbe
- Page 49 and 50: 17th International Symposium on Ice
- Page 51 and 52: The refrozen lead ice is assumed to
- Page 53 and 54: Cumulative area fraction Four Ice T
- Page 55 and 56: 17th International Symposium on Ice
- Page 57 and 58: It is known that the auto-correlati
- Page 59 and 60: Fig.1. Radar ice images: R0000920 a
- Page 61 and 62:
application of PIV, the comparison
- Page 63 and 64:
OBSERVATIONS We set up five observa
- Page 65 and 66:
Variations of snow depth and sea-ic
- Page 67 and 68:
217 Fig. 5. Profiles of structure,
- Page 69 and 70:
characterized by columnar structure
- Page 71 and 72:
17th International Symposium on Ice
- Page 73 and 74:
same cross section in different spa
- Page 75 and 76:
The Ostu method confirms the thresh
- Page 77 and 78:
17th International Symposium on Ice
- Page 79 and 80:
Equations and Boundary Conditions
- Page 81 and 82:
dispersion relation f 0 (κ) = 1/κ
- Page 83 and 84:
Fig. 2: (a) The behaviour of |R| in
- Page 85 and 86:
17th International Symposium on Ice
- Page 87 and 88:
Schemes of ice passing through hydr
- Page 89 and 90:
Submerged flow Entrance drop in con
- Page 91 and 92:
1. Flow from the hole 2. Flowing th
- Page 93 and 94:
crushing in cooperation with piers
- Page 95 and 96:
an excellent analysis on ice jam re
- Page 97 and 98:
simulated water discharge, ice disc
- Page 99 and 100:
The ice jam release simulation last
- Page 101 and 102:
17th International Symposium on Ice
- Page 103 and 104:
(1982), where temperatures 20 cm be
- Page 105 and 106:
255
- Page 107 and 108:
changes in hyporheic flow may affec
- Page 109 and 110:
growth processes is quite interesti
- Page 111 and 112:
Fig.3. Temperature variations at th
- Page 113 and 114:
During the snowfall and subsequent
- Page 115 and 116:
Fig. 7. Relation of oxygen and hydr
- Page 117 and 118:
the experiment seems to be shorter
- Page 119 and 120:
changes in sea ice concentration in
- Page 121 and 122:
10 Point for Point Concentrations 1
- Page 123 and 124:
NASA Team - Video Mean 10 67-70: NM
- Page 125 and 126:
17th International Symposium on Ice
- Page 127 and 128:
There can also be cases where a sno
- Page 129 and 130:
FIELD TEST OF FLEXURAL STRENGTH Tes
- Page 131 and 132:
The ratio of elastic modulus to fle
- Page 133 and 134:
17th International Symposium on Ice
- Page 135 and 136:
Shape and installation of the FICS
- Page 137 and 138:
conspicuous and the currents beneat
- Page 139 and 140:
For the Bb/BL=0.71 model, tip vorti
- Page 141 and 142:
17th International Symposium on Ice
- Page 143 and 144:
are found. The pixels within this s
- Page 145 and 146:
Experiment Table 1. Summarized resu
- Page 147 and 148:
CONCLUSION From the results of thes
- Page 149 and 150:
The ice run in the region of the sp
- Page 151 and 152:
Table 2. Time to pass the distance
- Page 153 and 154:
Free surface drawdown above upstrea
- Page 155 and 156:
а) x/H 3.6 3.2 2.8 2.4 2 1.6 1.2 0
- Page 157 and 158:
Table. Approximate values of free s
- Page 159 and 160:
17th International Symposium on Ice
- Page 161 and 162:
where I is a down gradient, B is st
- Page 163 and 164:
17th International Symposium on Ice
- Page 165 and 166:
THE MEASURING SYSTEM MT Uikku is a
- Page 167 and 168:
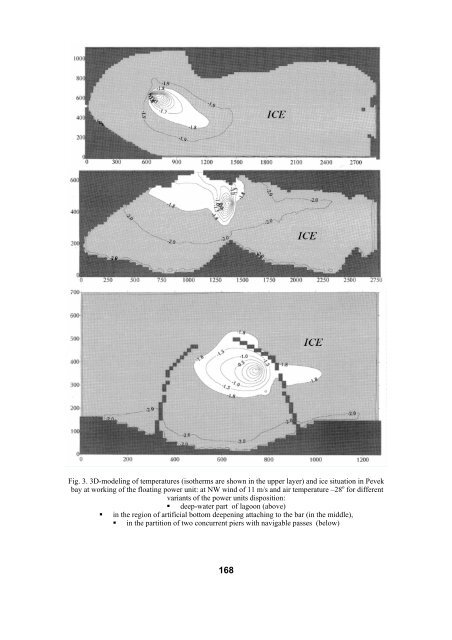
Near the shore where the ice was th
- Page 169 and 170:
The ship had to use full power for
- Page 171 and 172:
of Bothnia. She got stuck in ice 5
- Page 173 and 174:
17th International Symposium on Ice
- Page 175 and 176:
the position of ice edge, defined a
- Page 177 and 178:
As the ice cover rafts and thickens
- Page 179 and 180:
Fig. 5 The Clarkson wave tank We ap
- Page 181 and 182:
17th International Symposium on Ice
- Page 183 and 184:
Thermometer Temperature Change with
- Page 185 and 186:
The wave attenuates with respect to
- Page 187 and 188:
REFERENCES Ackley, S.F., H.H. Shen,
- Page 189 and 190:
ICE CONDITIONS ON RESERVOIRS The ic
- Page 191 and 192:
Weakened ice Tunnel Dam Fig 1. Exam
- Page 193 and 194:
17th International Symposium on Ice
- Page 195 and 196:
River ice differs in crack structur
- Page 197 and 198:
Fig.8. Lower ice surface Fig.9. The
- Page 199 and 200:
17th International Symposium on Ice
- Page 201 and 202:
finer spatial resolution of the 85G
- Page 203 and 204:
Several polynyas (note that unless
- Page 205 and 206:
a) b) c) Fig. 4: Charts of the surf
- Page 207 and 208:
17th International Symposium on Ice
- Page 209 and 210:
ubble might have to be cleared befo
- Page 211 and 212:
Table 2. Suggested loading window c
- Page 213 and 214:
tankers. If loading windows should
- Page 215 and 216:
17th International Symposium on Ice
- Page 217 and 218:
pollutant propagation in tidal ice
- Page 219 and 220:
THE 1-D ICE JAM MODEL Model of inte
- Page 221 and 222:
group roughness in the Manning form
- Page 223 and 224:
Figure 3a corresponds to an initial