Chemical & Engineering News Digital Edition ... - IMM@BUCT
Chemical & Engineering News Digital Edition ... - IMM@BUCT
Chemical & Engineering News Digital Edition ... - IMM@BUCT

You also want an ePaper? Increase the reach of your titles
YUMPU automatically turns print PDFs into web optimized ePapers that Google loves.
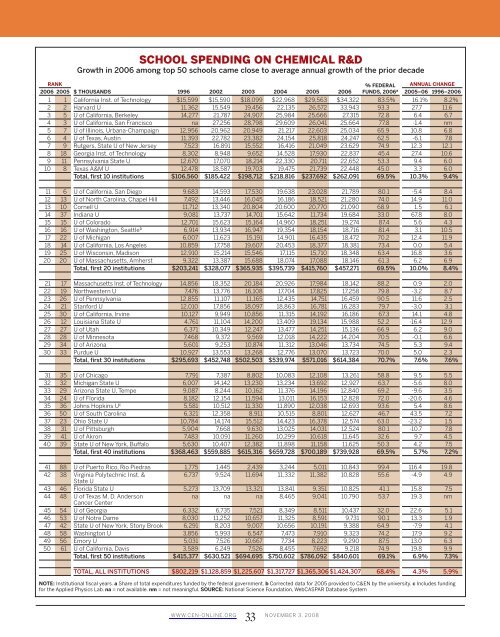
SCHOOL SPENDING ON CHEMICAL R&D<br />
Growth in 2006 among top 50 schools came close to average annual growth of the prior decade<br />
RANK<br />
% FEDERAL ANNUAL CHANGE<br />
2006 2005 $ THOUSANDS 1996 2002 2003 2004 2005 2006 FUNDS, 2006 a 2005–06 1996–2006<br />
1 1 California Inst. of Technology $15,599 $15,590 $18,099 $22,968 $29,563 $34,322 83.5% 16.1% 8.2%<br />
2 2 Harvard U 11,362 15,549 19,456 22,135 26,572 33,943 93.3 27.7 11.6<br />
3 5 U of California, Berkeley 14,277 21,787 24,907 25,984 25,666 27,315 72.8 6.4 6.7<br />
4 3 U of California, San Francisco na 27,256 28,798 29,609 26,041 25,664 77.8 -1.4 nm<br />
5 7 U of Illinois, Urbana-Champaign 12,956 20,962 20,949 21,217 22,603 25,034 65.9 10.8 6.8<br />
6 4 U of Texas, Austin 11,393 22,782 23,382 24,154 25,818 24,247 62.5 -6.1 7.8<br />
7 9 Rutgers, State U of New Jersey 7,523 16,891 15,552 16,416 21,049 23,629 74.9 12.3 12.1<br />
8 18 Georgia Inst. of Technology 8,302 8,948 9,652 14,528 17,930 22,837 45.4 27.4 10.6<br />
9 11 Pennsylvania State U 12,670 17,070 18,214 22,330 20,711 22,652 53.3 9.4 6.0<br />
10 8 Texas A&M U 12,478 18,587 19,703 19,475 21,739 22,448 45.0 3.3 6.0<br />
Total, first 10 institutions $106,560 $185,422 $198,712 $218,816 $237,692 $262,091 69.5% 10.3% 9.4%<br />
11 6 U of California, San Diego 9,683 14,593 17,530 19,638 23,028 21,789 80.1 -5.4 8.4<br />
12 13 U of North Carolina, Chapel Hill 7,492 13,446 16,045 16,186 18,521 21,280 74.0 14.9 11.0<br />
13 10 Cornell U 11,712 13,340 20,804 20,600 20,770 21,090 68.9 1.5 6.1<br />
14 37 Indiana U 9,081 13,737 14,701 15,642 11,734 19,684 33.0 67.8 8.0<br />
15 15 U of Colorado 12,701 15,623 15,164 14,960 18,251 19,274 87.4 5.6 4.3<br />
16 16 U of Washington, Seattle b 6,914 13,934 16,947 19,354 18,154 18,716 81.4 3.1 10.5<br />
17 22 U of Michigan 6,007 11,623 15,191 14,901 16,435 18,472 70.2 12.4 11.9<br />
18 14 U of California, Los Angeles 10,859 17,758 19,607 20,453 18,377 18,381 73.4 0.0 5.4<br />
19 25 U of Wisconsin, Madison 12,910 15,214 15,546 17,115 15,710 18,348 63.4 16.8 3.6<br />
20 20 U of Massachusetts, Amherst 9,322 13,387 15,688 18,074 17,088 18,146 61.3 6.2 6.9<br />
Total, first 20 institutions $203,241 $328,077 $365,935 $395,739 $415,760 $457,271 69.5% 10.0% 8.4%<br />
21 17 Massachusetts Inst. of Technology 14,856 18,352 20,184 20,926 17,984 18,142 88.2 0.9 2.0<br />
22 19 Northwestern U 7,476 13,776 16,108 17,704 17,825 17,258 79.8 -3.2 8.7<br />
23 26 U of Pennsylvania 12,855 11,107 11,165 12,435 14,751 16,459 90.5 11.6 2.5<br />
24 21 Stanford U 12,010 17,856 18,097 18,863 16,781 16,283 79.7 -3.0 3.1<br />
25 30 U of California, Irvine 10,127 9,949 10,856 11,315 14,192 16,186 67.3 14.1 4.8<br />
26 12 Louisiana State U 4,761 11,104 14,200 13,409 19,134 15,988 52.2 -16.4 12.9<br />
27 27 U of Utah 6,371 10,349 12,247 13,477 14,251 15,136 66.9 6.2 9.0<br />
28 28 U of Minnesota 7,468 9,372 9,569 12,018 14,222 14,204 70.5 -0.1 6.6<br />
29 34 U of Arizona 5,601 9,253 10,874 11,312 13,046 13,734 74.5 5.3 9.4<br />
30 33 Purdue U 10,927 13,553 13,268 12,776 13,070 13,723 70.0 5.0 2.3<br />
Total, first 30 institutions $295,693 $452,748 $502,503 $539,974 $571,016 $614,384 70.7% 7.6% 7.6%<br />
31 35 U of Chicago 7,791 7,387 8,802 10,083 12,108 13,261 58.8 9.5 5.5<br />
32 32 Michigan State U 6,007 14,142 13,230 13,234 13,692 12,927 63.7 -5.6 8.0<br />
33 29 Arizona State U, Tempe 9,087 8,244 10,162 11,376 14,196 12,840 69.2 -9.6 3.5<br />
34 24 U of Florida 8,182 12,154 11,594 13,011 16,153 12,828 72.0 -20.6 4.6<br />
35 36 Johns Hopkins U c 5,581 10,512 11,330 11,890 12,038 12,693 93.6 5.4 8.6<br />
36 50 U of South Carolina 6,321 12,358 8,911 10,515 8,801 12,627 46.7 43.5 7.2<br />
37 23 Ohio State U 10,784 14,174 15,512 14,423 16,378 12,574 63.0 -23.2 1.5<br />
38 31 U of Pittsburgh 5,904 7,668 9,630 13,025 14,031 12,524 80.1 -10.7 7.8<br />
39 41 U of Akron 7,483 10,091 11,260 10,299 10,618 11,645 32.6 9.7 4.5<br />
40 39 State U of New York, Buffalo 5,630 10,407 12,382 11,898 11,158 11,625 50.3 4.2 7.5<br />
Total, first 40 institutions $368,463 $559,885 $615,316 $659,728 $700,189 $739,928 69.5% 5.7% 7.2%<br />
41 88 U of Puerto Rico, Rio Piedras 1,775 1,445 2,439 3,244 5,011 10,843 99.4 116.4 19.8<br />
42 38 Virginia Polytechnic Inst. &<br />
6,737 9,524 11,694 11,332 11,382 10,828 55.6 -4.9 4.9<br />
State U<br />
43 46 Florida State U 5,273 13,709 13,321 13,841 9,351 10,825 41.1 15.8 7.5<br />
44 48 U of Texas M. D. Anderson<br />
na na na 8,465 9,041 10,790 53.7 19.3 nm<br />
Cancer Center<br />
45 54 U of Georgia 6,332 6,735 7,521 8,349 8,511 10,437 32.0 22.6 5.1<br />
46 53 U of Notre Dame 8,030 11,252 10,657 11,325 8,591 9,731 90.1 13.3 1.9<br />
47 42 State U of New York, Stony Brook 6,291 8,203 9,007 10,656 10,191 9,388 64.9 -7.9 4.1<br />
48 58 Washington U 3,856 5,993 6,547 7,473 7,910 9,323 74.2 17.9 9.2<br />
49 56 Emory U 5,031 7,526 10,667 7,734 8,223 9,290 87.5 13.0 6.3<br />
50 61 U of California, Davis 3,589 6,249 7,526 8,455 7,692 9,218 74.9 19.8 9.9<br />
Total, first 50 institutions $415,377 $630,521 $694,695 $750,602 $786,092 $840,601 69.1% 6.9% 7.3%<br />
TOTAL, ALL INSTITUTIONS $802,219 $1,128,859 $1,225,607 $1,317,727 $1,365,306 $1,424,307 68.4% 4.3% 5.9%<br />
NOTE: Institutional fiscal years. a Share of total expenditures funded by the federal government. b Corrected data for 2005 provided to C&EN by the university. c Includes funding<br />
for the Applied Physics Lab. na = not available. nm = not meaningful. SOURCE: National Science Foundation, WebCASPAR Database System<br />
WWW.CEN-ONLINE.ORG 33 NOVEMBER 3, 2008