Cincinnati Bengals 2009 Media Guide.indb - Bengals Home
Cincinnati Bengals 2009 Media Guide.indb - Bengals Home
Cincinnati Bengals 2009 Media Guide.indb - Bengals Home

You also want an ePaper? Increase the reach of your titles
YUMPU automatically turns print PDFs into web optimized ePapers that Google loves.
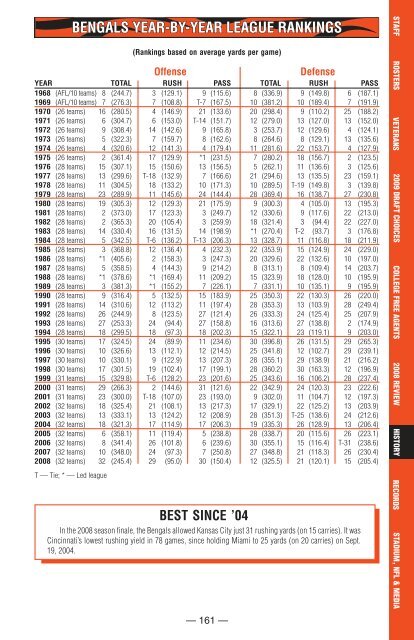
BENGALS YEAR-BY-YEAR LEAGUE RANKINGS<br />
STAFF<br />
(Rankings based on average yards per game)<br />
Offense<br />
— 161 —<br />
Defense<br />
YEAR TOTAL RUSH PASS TOTAL RUSH PASS<br />
1968 (AFL/10 teams) 8 (244.7) 3 (129.1) 9 (115.6) 8 (336.9) 9 (149.8) 6 (187.1)<br />
1969 (AFL/10 teams) 7 (276.3) 7 (108.8) T-7 (167.5) 10 (381.2) 10 (189.4) 7 (191.9)<br />
1970 (26 teams) 16 (280.5) 4 (146.9) 21 (133.6) 20 (298.4) 9 (110.2) 25 (188.2)<br />
1971 (26 teams) 6 (304.7) 6 (153.0) T-14 (151.7) 12 (279.0) 13 (127.0) 13 (152.0)<br />
1972 (26 teams) 9 (308.4) 14 (142.6) 9 (165.8) 3 (253.7) 12 (129.6) 4 (124.1)<br />
1973 (26 teams) 5 (322.3) 7 (159.7) 8 (162.6) 8 (264.6) 8 (129.1) 13 (135.6)<br />
1974 (26 teams) 4 (320.6) 12 (141.3) 4 (179.4) 11 (281.6) 22 (153.7) 4 (127.9)<br />
1975 (26 teams) 2 (361.4) 17 (129.9) *1 (231.5) 7 (280.2) 18 (156.7) 2 (123.5)<br />
1976 (28 teams) 15 (307.1) 15 (150.6) 13 (156.5) 5 (262.1) 11 (136.6) 3 (125.6)<br />
1977 (28 teams) 13 (299.6) T-18 (132.9) 7 (166.6) 21 (294.6) 13 (135.5) 23 (159.1)<br />
1978 (28 teams) 11 (304.5) 18 (133.2) 10 (171.3) 10 (289.5) T-19 (149.8) 3 (139.8)<br />
1979 (28 teams) 23 (289.9) 11 (145.6) 24 (144.4) 28 (369.4) 16 (138.7) 27 (230.8)<br />
1980 (28 teams) 19 (305.3) 12 (129.3) 21 (175.9) 9 (300.3) 4 (105.0) 13 (195.3)<br />
1981 (28 teams) 2 (373.0) 17 (123.3) 3 (249.7) 12 (330.6) 9 (117.6) 22 (213.0)<br />
1982 (28 teams) 2 (365.3) 20 (105.4) 3 (259.9) 18 (321.4) 3 (94.4) 22 (227.0)<br />
1983 (28 teams) 14 (330.4) 16 (131.5) 14 (198.9) *1 (270.4) T-2 (93.7) 3 (176.8)<br />
1984 (28 teams) 5 (342.5) T-6 (136.2) T-13 (206.3) 13 (328.7) 11 (116.8) 18 (211.9)<br />
1985 (28 teams) 3 (368.8) 12 (136.4) 4 (232.3) 22 (353.9) 15 (124.9) 24 (229.0)<br />
1986 (28 teams) *1 (405.6) 2 (158.3) 3 (247.3) 20 (329.6) 22 (132.6) 10 (197.0)<br />
1987 (28 teams) 5 (358.5) 4 (144.3) 9 (214.2) 8 (313.1) 8 (109.4) 14 (203.7)<br />
1988 (28 teams) *1 (378.6) *1 (169.4) 11 (209.2) 15 (323.9) 18 (128.0) 10 (195.9)<br />
1989 (28 teams) 3 (381.3) *1 (155.2) 7 (226.1) 7 (331.1) 10 (135.1) 9 (195.9)<br />
1990 (28 teams) 9 (316.4) 5 (132.5) 15 (183.9) 25 (350.3) 22 (130.3) 26 (220.0)<br />
1991 (28 teams) 14 (310.6) 12 (113.2) 11 (197.4) 28 (353.3) 13 (103.9) 28 (249.4)<br />
1992 (28 teams) 26 (244.9) 8 (123.5) 27 (121.4) 26 (333.3) 24 (125.4) 25 (207.9)<br />
1993 (28 teams) 27 (253.3) 24 (94.4) 27 (158.8) 16 (313.6) 27 (138.8) 2 (174.9)<br />
1994 (28 teams) 18 (299.5) 18 (97.3) 18 (202.3) 15 (322.1) 23 (119.1) 9 (203.0)<br />
1995 (30 teams) 17 (324.5) 24 (89.9) 11 (234.6) 30 (396.8) 26 (131.5) 29 (265.3)<br />
1996 (30 teams) 10 (326.6) 13 (112.1) 12 (214.5) 25 (341.8) 12 (102.7) 29 (239.1)<br />
1997 (30 teams) 10 (330.1) 9 (122.9) 13 (207.3) 28 (355.1) 29 (138.9) 21 (216.2)<br />
1998 (30 teams) 17 (301.5) 19 (102.4) 17 (199.1) 28 (360.2) 30 (163.3) 12 (196.9)<br />
1999 (31 teams) 15 (329.8) T-6 (128.2) 23 (201.6) 25 (343.6) 16 (106.2) 28 (237.4)<br />
2000 (31 teams) 29 (266.3) 2 (144.6) 31 (121.6) 22 (342.9) 24 (120.3) 23 (222.6)<br />
2001 (31 teams) 23 (300.0) T-18 (107.0) 23 (193.0) 9 (302.0) 11 (104.7) 12 (197.3)<br />
2002 (32 teams) 18 (325.4) 21 (108.1) 13 (217.3) 17 (329.1) 22 (125.2) 13 (203.9)<br />
2003 (32 teams) 13 (333.1) 13 (124.2) 12 (208.9) 28 (351.3) T-25 (138.6) 24 (212.6)<br />
2004 (32 teams) 18 (321.3) 17 (114.9) 17 (206.3) 19 (335.3) 26 (128.9) 13 (206.4)<br />
2005 (32 teams) 6 (358.1) 11 (119.4) 5 (238.8) 28 (338.7) 20 (115.6) 26 (223.1)<br />
2006 (32 teams) 8 (341.4) 26 (101.8) 6 (239.6) 30 (355.1) 15 (116.4) T-31 (238.6)<br />
2007 (32 teams) 10 (348.0) 24 (97.3) 7 (250.8) 27 (348.8) 21 (118.3) 26 (230.4)<br />
2008 (32 teams) 32 (245.4) 29 (95.0) 30 (150.4) 12 (325.5) 21 (120.1) 15 (205.4)<br />
T — Tie; * — Led league<br />
BEST SINCE ’04<br />
In the 2008 season fi nale, the <strong>Bengals</strong> allowed Kansas City just 31 rushing yards (on 15 carries). It was<br />
<strong>Cincinnati</strong>’s lowest rushing yield in 78 games, since holding Miami to 25 yards (on 20 carries) on Sept.<br />
19, 2004.<br />
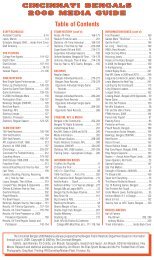
ROSTERS<br />
VETERANS<br />
<strong>2009</strong> DRAFT CHOICES<br />
COLLEGE FREE AGENTS<br />
2008 REVIEW<br />
HISTORY RECORDS STADIUM , NFL & MEDIA