Odfjell SE Annual Report 2012
Odfjell SE Annual Report 2012
Odfjell SE Annual Report 2012

Create successful ePaper yourself
Turn your PDF publications into a flip-book with our unique Google optimized e-Paper software.
odfjell group<br />
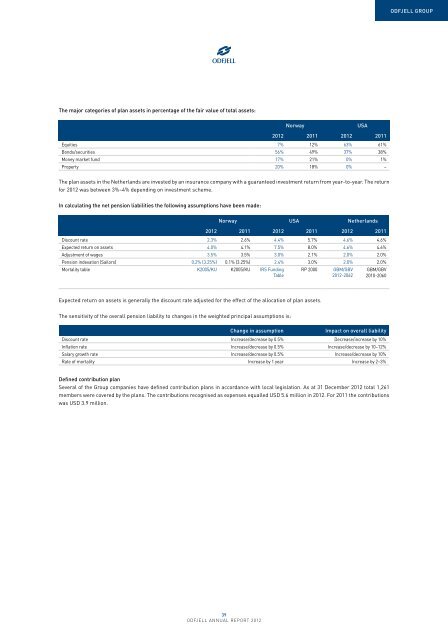
The major categories of plan assets in percentage of the fair value of total assets:<br />
Norway USA<br />
<strong>2012</strong> 2011 <strong>2012</strong> 2011<br />
Equities 7% 12% 63% 61%<br />
Bonds/securities 56% 49% 37% 38%<br />
Money market fund 17% 21% 0% 1%<br />
Property 20% 18% 0% –<br />
The plan assets in the Netherlands are invested by an insurance company with a guaranteed investment return from year-to-year. The return<br />
for <strong>2012</strong> was between 3%–4% depending on investment scheme.<br />
In calculating the net pension liabilities the following assumptions have been made:<br />
Norway USA Netherlands<br />
<strong>2012</strong> 2011 <strong>2012</strong> 2011 <strong>2012</strong> 2011<br />
Discount rate 2.3% 2.6% 4.4% 5.7% 4.6% 4.6%<br />
Expected return on assets 4.0% 4.1% 7.5% 8.0% 4.6% 4.6%<br />
Adjustment of wages 3.5% 3.5% 3.0% 2.1% 2.0% 2.0%<br />
Pension indexation (Sailors) 0.2% (3.25%) 0.1% (3.25%) 2.4% 3.0% 2.0% 2.0%<br />
Mortality table K2005/KU K2005/KU IRS Funding<br />
Table<br />
RP 2000 GBM/GBV<br />
<strong>2012</strong>-2062<br />
GBM/GBV<br />
2010-2060<br />
Expected return on assets is generally the discount rate adjusted for the effect of the allocation of plan assets.<br />
The sensitivity of the overall pension liability to changes in the weighted principal assumptions is:<br />
Change in assumption<br />
Impact on overall liability<br />
Discount rate Increase/decrease by 0.5% Decrease/increase by 10%<br />
Inflation rate Increase/decrease by 0.5% Increase/decrease by 10–12%<br />
Salary growth rate Increase/decrease by 0.5% Increase/decrease by 10%<br />
Rate of mortality Increase by 1 year Increase by 2–3%<br />
Defined contribution plan<br />
Several of the Group companies have defined contribution plans in accordance with local legislation. As at 31 December <strong>2012</strong> total 1,261<br />
members were covered by the plans. The contributions recognised as expenses equalled USD 5.6 million in <strong>2012</strong>. For 2011 the contributions<br />
was USD 3.9 million.<br />
39<br />
odfjell annual report <strong>2012</strong>