

challenges facing express delivery services in canada's urban centres
challenges facing express delivery services in canada's urban centres
challenges facing express delivery services in canada's urban centres

You also want an ePaper? Increase the reach of your titles
YUMPU automatically turns print PDFs into web optimized ePapers that Google loves.
Institute of Hous<strong>in</strong>g & Mobility<br />
Challenges <strong>fac<strong>in</strong>g</strong> the EDS <strong>in</strong>dustry <strong>in</strong> Canada's <strong>urban</strong> <strong>centres</strong><br />
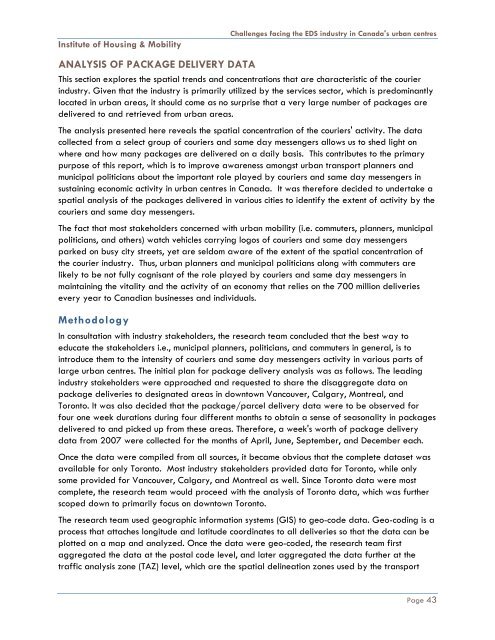
ANALYSIS OF PACKAGE DELIVERY DATA<br />
This section explores the spatial trends and concentrations that are characteristic of the courier<br />
<strong>in</strong>dustry. Given that the <strong>in</strong>dustry is primarily utilized by the <strong>services</strong> sector, which is predom<strong>in</strong>antly<br />
located <strong>in</strong> <strong>urban</strong> areas, it should come as no surprise that a very large number of packages are<br />
delivered to and retrieved from <strong>urban</strong> areas.<br />
The analysis presented here reveals the spatial concentration of the couriers' activity. The data<br />
collected from a select group of couriers and same day messengers allows us to shed light on<br />
where and how many packages are delivered on a daily basis. This contributes to the primary<br />
purpose of this report, which is to improve awareness amongst <strong>urban</strong> transport planners and<br />
municipal politicians about the important role played by couriers and same day messengers <strong>in</strong><br />
susta<strong>in</strong><strong>in</strong>g economic activity <strong>in</strong> <strong>urban</strong> <strong>centres</strong> <strong>in</strong> Canada. It was therefore decided to undertake a<br />
spatial analysis of the packages delivered <strong>in</strong> various cities to identify the extent of activity by the<br />
couriers and same day messengers.<br />
The fact that most stakeholders concerned with <strong>urban</strong> mobility (i.e. commuters, planners, municipal<br />
politicians, and others) watch vehicles carry<strong>in</strong>g logos of couriers and same day messengers<br />
parked on busy city streets, yet are seldom aware of the extent of the spatial concentration of<br />
the courier <strong>in</strong>dustry. Thus, <strong>urban</strong> planners and municipal politicians along with commuters are<br />
likely to be not fully cognisant of the role played by couriers and same day messengers <strong>in</strong><br />
ma<strong>in</strong>ta<strong>in</strong><strong>in</strong>g the vitality and the activity of an economy that relies on the 700 million deliveries<br />
every year to Canadian bus<strong>in</strong>esses and <strong>in</strong>dividuals.<br />
Methodology<br />
In consultation with <strong>in</strong>dustry stakeholders, the research team concluded that the best way to<br />
educate the stakeholders i.e., municipal planners, politicians, and commuters <strong>in</strong> general, is to<br />
<strong>in</strong>troduce them to the <strong>in</strong>tensity of couriers and same day messengers activity <strong>in</strong> various parts of<br />
large <strong>urban</strong> <strong>centres</strong>. The <strong>in</strong>itial plan for package <strong>delivery</strong> analysis was as follows. The lead<strong>in</strong>g<br />
<strong>in</strong>dustry stakeholders were approached and requested to share the disaggregate data on<br />
package deliveries to designated areas <strong>in</strong> downtown Vancouver, Calgary, Montreal, and<br />
Toronto. It was also decided that the package/parcel <strong>delivery</strong> data were to be observed for<br />
four one week durations dur<strong>in</strong>g four different months to obta<strong>in</strong> a sense of seasonality <strong>in</strong> packages<br />
delivered to and picked up from these areas. Therefore, a week's worth of package <strong>delivery</strong><br />
data from 2007 were collected for the months of April, June, September, and December each.<br />
Once the data were compiled from all sources, it became obvious that the complete dataset was<br />
available for only Toronto. Most <strong>in</strong>dustry stakeholders provided data for Toronto, while only<br />
some provided for Vancouver, Calgary, and Montreal as well. S<strong>in</strong>ce Toronto data were most<br />
complete, the research team would proceed with the analysis of Toronto data, which was further<br />
scoped down to primarily focus on downtown Toronto.<br />
The research team used geographic <strong>in</strong>formation systems (GIS) to geo-code data. Geo-cod<strong>in</strong>g is a<br />
process that attaches longitude and latitude coord<strong>in</strong>ates to all deliveries so that the data can be<br />
plotted on a map and analyzed. Once the data were geo-coded, the research team first<br />
aggregated the data at the postal code level, and later aggregated the data further at the<br />
traffic analysis zone (TAZ) level, which are the spatial del<strong>in</strong>eation zones used by the transport<br />
Page 43


![Creative City Planning Framework [PDF] - City of Toronto](https://img.yumpu.com/24270607/1/190x245/creative-city-planning-framework-pdf-city-of-toronto.jpg?quality=85)