State of World Fisheries and Aquaculture 2004 - Library
State of World Fisheries and Aquaculture 2004 - Library
State of World Fisheries and Aquaculture 2004 - Library
You also want an ePaper? Increase the reach of your titles
YUMPU automatically turns print PDFs into web optimized ePapers that Google loves.
3<br />
WORLD REVIEW OF FISHERIES<br />
AND AQUACULTURE<br />
<strong>Fisheries</strong> resources: trends in production,<br />
utilization <strong>and</strong> trade<br />
OVERVIEW<br />
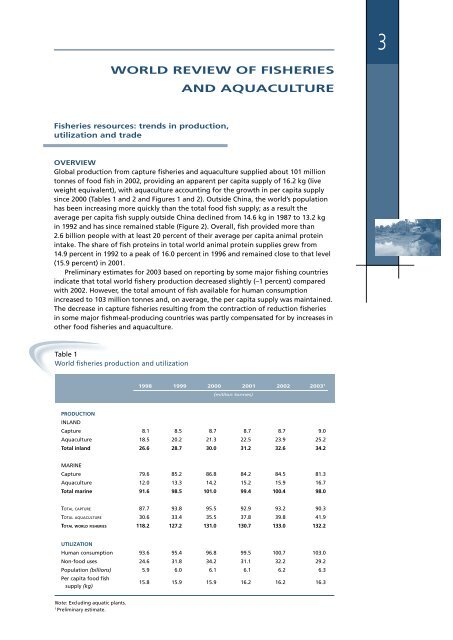
Global production from capture fisheries <strong>and</strong> aquaculture supplied about 101 million<br />
tonnes <strong>of</strong> food fish in 2002, providing an apparent per capita supply <strong>of</strong> 16.2 kg (live<br />
weight equivalent), with aquaculture accounting for the growth in per capita supply<br />
since 2000 (Tables 1 <strong>and</strong> 2 <strong>and</strong> Figures 1 <strong>and</strong> 2). Outside China, the world’s population<br />
has been increasing more quickly than the total food fish supply; as a result the<br />
average per capita fish supply outside China declined from 14.6 kg in 1987 to 13.2 kg<br />
in 1992 <strong>and</strong> has since remained stable (Figure 2). Overall, fish provided more than<br />
2.6 billion people with at least 20 percent <strong>of</strong> their average per capita animal protein<br />
intake. The share <strong>of</strong> fish proteins in total world animal protein supplies grew from<br />
14.9 percent in 1992 to a peak <strong>of</strong> 16.0 percent in 1996 <strong>and</strong> remained close to that level<br />
(15.9 percent) in 2001.<br />
Preliminary estimates for 2003 based on reporting by some major fishing countries<br />
indicate that total world fishery production decreased slightly (–1 percent) compared<br />
with 2002. However, the total amount <strong>of</strong> fish available for human consumption<br />
increased to 103 million tonnes <strong>and</strong>, on average, the per capita supply was maintained.<br />
The decrease in capture fisheries resulting from the contraction <strong>of</strong> reduction fisheries<br />
in some major fishmeal-producing countries was partly compensated for by increases in<br />
other food fisheries <strong>and</strong> aquaculture.<br />
Table 1<br />
<strong>World</strong> fisheries production <strong>and</strong> utilization<br />
1998 1999 2000 2001 2002 2003 1<br />
(million tonnes)<br />
PRODUCTION<br />
INLAND<br />
Capture 8.1 8.5 8.7 8.7 8.7 9.0<br />
<strong>Aquaculture</strong> 18.5 20.2 21.3 22.5 23.9 25.2<br />
Total inl<strong>and</strong> 26.6 28.7 30.0 31.2 32.6 34.2<br />
MARINE<br />
Capture 79.6 85.2 86.8 84.2 84.5 81.3<br />
<strong>Aquaculture</strong> 12.0 13.3 14.2 15.2 15.9 16.7<br />
Total marine 91.6 98.5 101.0 99.4 100.4 98.0<br />
TOTAL CAPTURE 87.7 93.8 95.5 92.9 93.2 90.3<br />
TOTAL AQUACULTURE 30.6 33.4 35.5 37.8 39.8 41.9<br />
TOTAL WORLD FISHERIES 118.2 127.2 131.0 130.7 133.0 132.2<br />
UTILIZATION<br />
Human consumption 93.6 95.4 96.8 99.5 100.7 103.0<br />
Non-food uses 24.6 31.8 34.2 31.1 32.2 29.2<br />
Population (billions) 5.9 6.0 6.1 6.1 6.2 6.3<br />
Per capita food fish<br />
supply (kg)<br />
15.8 15.9 15.9 16.2 16.2 16.3<br />
Note: Excluding aquatic plants.<br />
1<br />
Preliminary estimate.


