State of World Fisheries and Aquaculture 2004 - Library
State of World Fisheries and Aquaculture 2004 - Library
State of World Fisheries and Aquaculture 2004 - Library
Create successful ePaper yourself
Turn your PDF publications into a flip-book with our unique Google optimized e-Paper software.
ix<br />
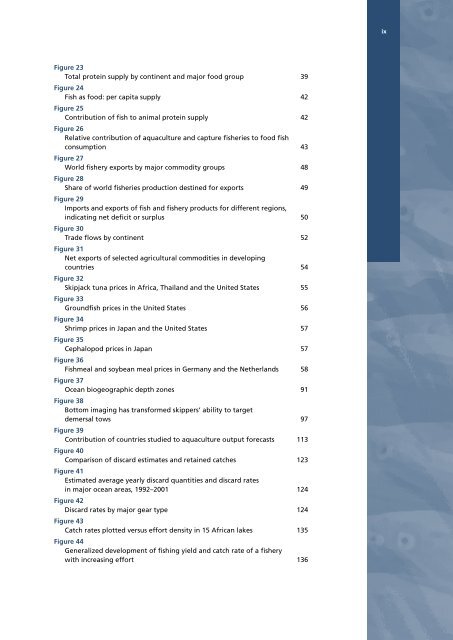
Figure 23<br />
Total protein supply by continent <strong>and</strong> major food group 39<br />
Figure 24<br />
Fish as food: per capita supply 42<br />
Figure 25<br />
Contribution <strong>of</strong> fish to animal protein supply 42<br />
Figure 26<br />
Relative contribution <strong>of</strong> aquaculture <strong>and</strong> capture fisheries to food fish<br />
consumption 43<br />
Figure 27<br />
<strong>World</strong> fishery exports by major commodity groups 48<br />
Figure 28<br />
Share <strong>of</strong> world fisheries production destined for exports 49<br />
Figure 29<br />
Imports <strong>and</strong> exports <strong>of</strong> fish <strong>and</strong> fishery products for different regions,<br />
indicating net deficit or surplus 50<br />
Figure 30<br />
Trade flows by continent 52<br />
Figure 31<br />
Net exports <strong>of</strong> selected agricultural commodities in developing<br />
countries 54<br />
Figure 32<br />
Skipjack tuna prices in Africa, Thail<strong>and</strong> <strong>and</strong> the United <strong>State</strong>s 55<br />
Figure 33<br />
Groundfish prices in the United <strong>State</strong>s 56<br />
Figure 34<br />
Shrimp prices in Japan <strong>and</strong> the United <strong>State</strong>s 57<br />
Figure 35<br />
Cephalopod prices in Japan 57<br />
Figure 36<br />
Fishmeal <strong>and</strong> soybean meal prices in Germany <strong>and</strong> the Netherl<strong>and</strong>s 58<br />
Figure 37<br />
Ocean biogeographic depth zones 91<br />
Figure 38<br />
Bottom imaging has transformed skippers’ ability to target<br />
demersal tows 97<br />
Figure 39<br />
Contribution <strong>of</strong> countries studied to aquaculture output forecasts 113<br />
Figure 40<br />
Comparison <strong>of</strong> discard estimates <strong>and</strong> retained catches 123<br />
Figure 41<br />
Estimated average yearly discard quantities <strong>and</strong> discard rates<br />
in major ocean areas, 1992–2001 124<br />
Figure 42<br />
Discard rates by major gear type 124<br />
Figure 43<br />
Catch rates plotted versus effort density in 15 African lakes 135<br />
Figure 44<br />
Generalized development <strong>of</strong> fishing yield <strong>and</strong> catch rate <strong>of</strong> a fishery<br />
with increasing effort 136


