

State of World Fisheries and Aquaculture 2004 - Library
State of World Fisheries and Aquaculture 2004 - Library
State of World Fisheries and Aquaculture 2004 - Library

You also want an ePaper? Increase the reach of your titles
YUMPU automatically turns print PDFs into web optimized ePapers that Google loves.
<strong>World</strong> review <strong>of</strong> fisheries <strong>and</strong> aquaculture<br />
13<br />
<br />
<br />
<br />
<br />
<br />
<br />
<br />
<br />
<br />
<br />
<br />
<br />
<br />
<br />
<br />
<br />
<br />
<br />
<br />
<br />
Africa <strong>and</strong> Asia contributed about 90 percent <strong>of</strong> global inl<strong>and</strong> capture production<br />
in 2002 (Figure 7). Compared with 2000, catches in 2002 have grown by about<br />
0.6 percent in the Asia inl<strong>and</strong> fishing area, 2 percent in Africa, <strong>and</strong> 9 percent in South<br />
America. Catches decreased in Europe (by 18 percent), North <strong>and</strong> Central America (by<br />
9.8 percent) <strong>and</strong> Oceania (by 0.5 percent).<br />
The principal ten producers accounted for about 66 percent <strong>of</strong> global production<br />
from inl<strong>and</strong> capture fisheries in 2002 (Figure 8). China, the top producer, has reported<br />
stable inl<strong>and</strong> catches since 1998 <strong>and</strong> still produces one-quarter <strong>of</strong> the global inl<strong>and</strong><br />
catches. The Russian Federation <strong>and</strong> Kenya, which ranked fifth <strong>and</strong> tenth respectively<br />
in 2000, dropped out <strong>of</strong> the top ten list in 2002 <strong>and</strong> were superseded by Myanmar<br />
<strong>and</strong> Brazil. The Russian Federation now ranks twelfth following a dramatic decrease in<br />
catch during the last two years.<br />
The bulk <strong>of</strong> world production (68.1 percent) came from developing countries<br />
other than China <strong>and</strong> only 6.1 percent from developed countries, classified either as<br />
“Economies in transition” or as “Industrialized countries” (Table 3). The divergence<br />
between developed <strong>and</strong> developing countries in the importance <strong>of</strong> inl<strong>and</strong> catches is<br />
further evidenced by the fact that, in 2002, not one developed country was among the<br />
top ten world producers (Figure 8).<br />
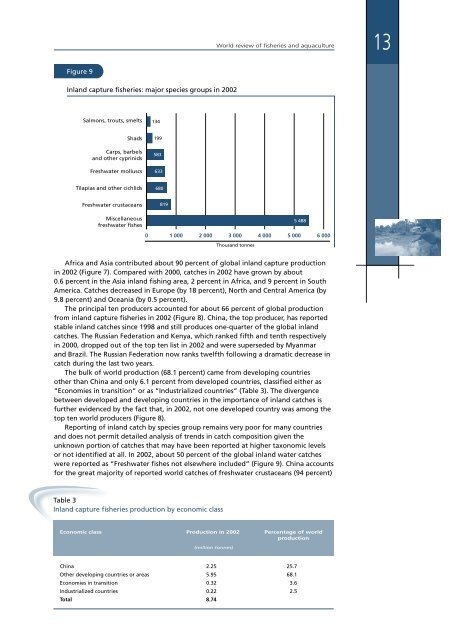
Reporting <strong>of</strong> inl<strong>and</strong> catch by species group remains very poor for many countries<br />
<strong>and</strong> does not permit detailed analysis <strong>of</strong> trends in catch composition given the<br />
unknown portion <strong>of</strong> catches that may have been reported at higher taxonomic levels<br />
or not identified at all. In 2002, about 50 percent <strong>of</strong> the global inl<strong>and</strong> water catches<br />
were reported as “Freshwater fishes not elsewhere included” (Figure 9). China accounts<br />
for the great majority <strong>of</strong> reported world catches <strong>of</strong> freshwater crustaceans (94 percent)<br />
Table 3<br />
Inl<strong>and</strong> capture fisheries production by economic class<br />
Economic class Production in 2002 Percentage <strong>of</strong> world<br />
production<br />
(million tonnes)<br />
China 2.25 25.7<br />
Other developing countries or areas 5.95 68.1<br />
Economies in transition 0.32 3.6<br />
Industrialized countries 0.22 2.5<br />
Total 8.74


