

State of World Fisheries and Aquaculture 2004 - Library
State of World Fisheries and Aquaculture 2004 - Library
State of World Fisheries and Aquaculture 2004 - Library

You also want an ePaper? Increase the reach of your titles
YUMPU automatically turns print PDFs into web optimized ePapers that Google loves.
<strong>World</strong> review <strong>of</strong> fisheries <strong>and</strong> aquaculture<br />
15<br />
Table 5<br />
<strong>World</strong> aquaculture production: average annual rate <strong>of</strong> growth for different species<br />
groups<br />
Time period Crustaceans Molluscs Freshwater<br />
fish<br />
Diadromous<br />
fish<br />
(percent)<br />
Marine fish<br />
Overall<br />
1970–2002 18.1 7.8 9.6 7.4 10.5 8.9<br />
1970–1980 23.9 5.6 6.0 6.5 14.1 6.3<br />
1980–1990 24.1 7.0 13.1 9.4 5.3 10.8<br />
1990–2000 9.9 5.3 7.8 7.9 12.3 10.5<br />
2000–2002 11.0 4.6 5.8 6.7 9.5 5.9<br />
annual increase <strong>of</strong> 6.1 percent in quantity <strong>and</strong> 2.9 percent in value, respectively, over<br />
reported figures for 2000. In 2002, countries in Asia accounted for 91.2 percent <strong>of</strong> the<br />
production quantity <strong>and</strong> 82 percent <strong>of</strong> the value. Of the world total, China is reported<br />
to produce 71.2 percent <strong>of</strong> the total quantity <strong>and</strong> 54.7 percent <strong>of</strong> the total value <strong>of</strong><br />
aquaculture production.<br />
Table 4 shows the top ten producers <strong>of</strong> fish, crustaceans <strong>and</strong> molluscs in 2002,<br />
together with the top ten producers in terms <strong>of</strong> annual growth in aquaculture<br />
production in 2000–02. All continents except Europe showed increases in production<br />
from 2000 to 2002; in Europe production remained relatively unchanged (0.1 percent<br />
annual decrease).<br />
<strong>World</strong> aquatic plant production in 2002 was 11.6 million tonnes (US$6.2 billion), <strong>of</strong><br />
which 8.8 million tonnes (US$4.4 billion) originated from China, 0.89 million tonnes<br />
from the Philippines <strong>and</strong> 0.56 million tonnes from Japan. Japanese kelp (Laminaria<br />
japonica – 4.7 million tonnes) showed the highest production, followed by Nori<br />
(Porphyra tenera – 1.3 million tonnes). An additional 4 million tonnes were reported by<br />
countries as “Aquatic plants” <strong>and</strong> not further specified.<br />
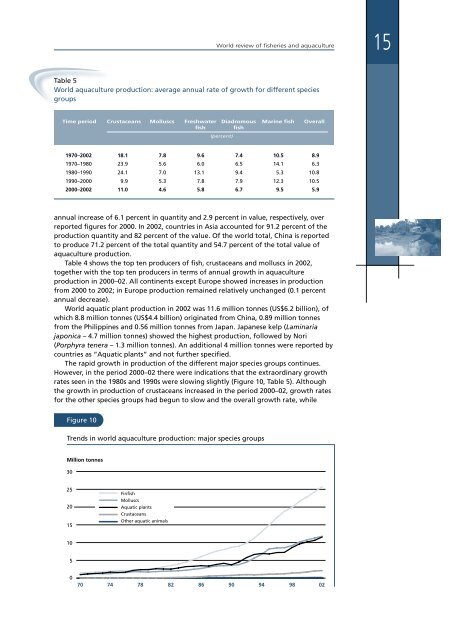
The rapid growth in production <strong>of</strong> the different major species groups continues.<br />
However, in the period 2000–02 there were indications that the extraordinary growth<br />
rates seen in the 1980s <strong>and</strong> 1990s were slowing slightly (Figure 10, Table 5). Although<br />
the growth in production <strong>of</strong> crustaceans increased in the period 2000–02, growth rates<br />
for the other species groups had begun to slow <strong>and</strong> the overall growth rate, while


