Employment Testing of Persons with Diasabling Conditions - IPAC
Employment Testing of Persons with Diasabling Conditions - IPAC
Employment Testing of Persons with Diasabling Conditions - IPAC
You also want an ePaper? Increase the reach of your titles
YUMPU automatically turns print PDFs into web optimized ePapers that Google loves.
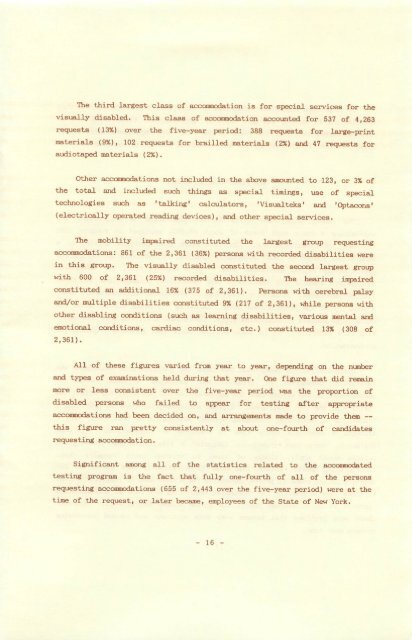
The third largest class <strong>of</strong> accommodation is for special services for the<br />
visually disabled. This class <strong>of</strong> accommodation accounted for 537 <strong>of</strong> 4,263<br />
requests (13%) over the five-year period: 388 requests for large-print<br />
materials (9%), 102 requests for brailled materials (2%) and 47 requests for<br />
audiotaped materials (2%).<br />
Other acconroodations not included in the above amounted to 123, or 3% <strong>of</strong><br />
the total and included such things as special timings, use <strong>of</strong> special<br />
technologies such as 'talking' calculators, 'Visualteks' and 'Optacons'<br />
(electrically operated reading devices), and other special services.<br />
The mobility impaired constituted the largest group requesting<br />
acconmodations: 861 <strong>of</strong> the 2,361 (36X) persons <strong>with</strong> recorded disabilities were<br />
in this group. The visually disabled constituted the second largest group<br />
<strong>with</strong> 600 <strong>of</strong> 2,361 (25%) recorded disabilities. The hearing impaired<br />
constituted an additional 16% (375 <strong>of</strong> 2,361). <strong>Persons</strong> <strong>with</strong> cerebral palsy<br />
and/or multiple disabilities constituted 9% (217 <strong>of</strong> 2,361), while persons <strong>with</strong><br />
other disabling conditions (such as learning disabilities, various mental and<br />
emotional conditions, cardiac conditions, etc.) constituted 13% (308 <strong>of</strong><br />
2,361).<br />
All <strong>of</strong> these figures varied from year to year, depending on the number<br />
and types <strong>of</strong> examinations held during that year. One figure that did remain<br />
more or less consistent over the five-year period was the proportion <strong>of</strong><br />
disabled persons who failed to appear for testing after appropriate<br />
accommodations had been decided on, and arrangements made to provide them —<br />
this figure ran pretty consistently at about one-fourth <strong>of</strong> candidates<br />
requesting<br />
acconmodation.<br />
Significant among all <strong>of</strong> the statistics related to the accommodated<br />
testing program is the fact that fully one-fourth <strong>of</strong> all <strong>of</strong> the persons<br />
requesting accommodations (655 <strong>of</strong> 2,443 over the five-year period) were at the<br />
time <strong>of</strong> the request, or later became, employees <strong>of</strong> the State <strong>of</strong> New York.<br />
- 16 -


