Content Outline for Teaching - Potosi School District - Home
Content Outline for Teaching - Potosi School District - Home
Content Outline for Teaching - Potosi School District - Home

You also want an ePaper? Increase the reach of your titles
YUMPU automatically turns print PDFs into web optimized ePapers that Google loves.
2<br />
Section 3<br />
<strong>Content</strong> <strong>Outline</strong><br />
<strong>for</strong> <strong>Teaching</strong><br />
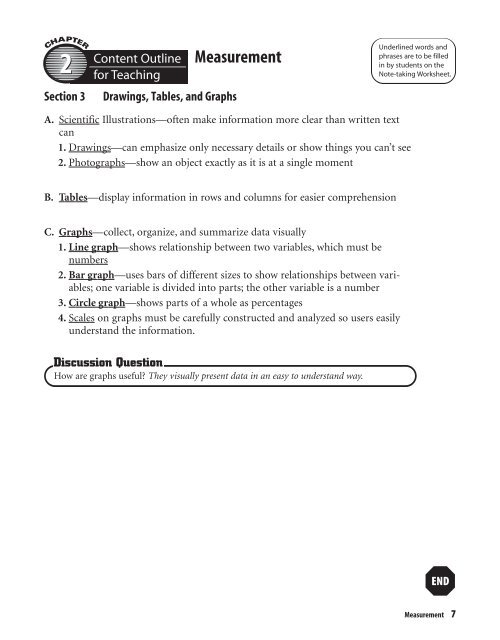
Drawings, Tables, and Graphs<br />
Measurement<br />
Underlined words and<br />
phrases are to be filled<br />
in by students on the<br />
Note-taking Worksheet.<br />
A. Scientific Illustrations—often make in<strong>for</strong>mation more clear than written text<br />
can<br />
1. Drawings—can emphasize only necessary details or show things you can’t see<br />
2. Photographs—show an object exactly as it is at a single moment<br />
B. Tables—display in<strong>for</strong>mation in rows and columns <strong>for</strong> easier comprehension<br />
C. Graphs—collect, organize, and summarize data visually<br />
1. Line graph—shows relationship between two variables, which must be<br />
numbers<br />
2. Bar graph—uses bars of different sizes to show relationships between variables;<br />
one variable is divided into parts; the other variable is a number<br />
3. Circle graph—shows parts of a whole as percentages<br />
4. Scales on graphs must be carefully constructed and analyzed so users easily<br />
understand the in<strong>for</strong>mation.<br />
Discussion Question<br />
How are graphs useful? They visually present data in an easy to understand way.<br />
Measurement 7