1. magnetic confinement - ENEA - Fusione
1. magnetic confinement - ENEA - Fusione
1. magnetic confinement - ENEA - Fusione

Create successful ePaper yourself
Turn your PDF publications into a flip-book with our unique Google optimized e-Paper software.
ITALIAN AGENCY FOR NEW TECHNOLOGIES<br />
ENERGY AND THE ENVIRONMENT<br />
NUCLEAR FUSION DIVISION<br />
2001 PROGRESS REPORT
Activities carried out by <strong>ENEA</strong> in the framework of the<br />
EURATOM-<strong>ENEA</strong> Association on Fusion<br />
(with minor exceptions as indicated in the list of contents)<br />
This report was prepared by the Scientific Publications Office from contributions provided by the scientific and<br />
technical staff of <strong>ENEA</strong>’s Fusion Division. Main collaborators in the preparation of this issue: Marisa Cecchini,<br />
Lucilla Crescentini, Lucilla Ghezzi.<br />
Editing:<br />
Carolyn Kent<br />
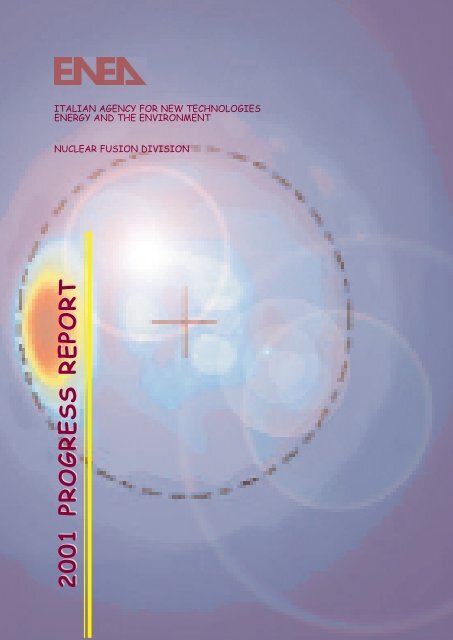
Cover: X-ray bright spot due to<br />
particle accumulation inside a<br />
<strong>magnetic</strong> island<br />
Published by:<br />
<strong>ENEA</strong> - Edizioni Scientifiche, Centro Ricerche Frascati, C.P . 65 - 00044 Frascati, Rome, Italy<br />
Tel: +39(06)9400 5670 Fax: +39(06)9400 5015<br />
e-mail: crescentini@frascati.enea.it
<strong>1.</strong> MAGNETIC CONFINEMENT 09<br />
<strong>1.</strong>1 Tokamak Physics 09<br />
<strong>1.</strong><strong>1.</strong>1 Introduction 09<br />
<strong>1.</strong><strong>1.</strong>2 Experimental results 09<br />
<strong>1.</strong><strong>1.</strong>3 Downshifted and upshifted experiments with ECRH in LHCD plasmas 13<br />
<strong>1.</strong><strong>1.</strong>4 MHD behaviour in improved <strong>confinement</strong> regimes and new phenomena<br />
by fast MHD analysis 14<br />
<strong>1.</strong><strong>1.</strong>5 Pellet injection 16<br />
<strong>1.</strong><strong>1.</strong>6 Boronisation: plasma results 17<br />
<strong>1.</strong><strong>1.</strong>7 Radiative improved mode in Ohmic plasmas 19<br />
<strong>1.</strong><strong>1.</strong>8 Fast x-ray imaging of the NSTX plasma by a micro-pattern gas<br />
detector with a GEM amplifier 20<br />
<strong>1.</strong><strong>1.</strong>9 JET 22<br />
<strong>1.</strong>2 FTU Facilities 27<br />
<strong>1.</strong>2.1 FTU machine 27<br />
<strong>1.</strong>2.2 Heating systems 30<br />
<strong>1.</strong>2.3 Diagnostics 31<br />
<strong>1.</strong>3 Plasma Theory 41<br />
CONTENTS<br />
<strong>1.</strong>3.1 Introduction 41<br />
<strong>1.</strong>3.2 IBW-induced poloidal rotation on FTU 42<br />
<strong>1.</strong>3.3 Generation of zonal flows by drift-Alfvén turbulence 43<br />
<strong>1.</strong>3.4 Drift and drift-Alfvén wave structures near a minimum-q surface 44<br />
<strong>1.</strong>3.5 Energetic particle mode destabilisation by ICR-heated fast<br />
ions in reversed shear plasmas 45<br />
<strong>1.</strong>3.6 Nonlinear dynamics of shear Alfvén modes and energetic ion<br />
<strong>confinement</strong> in reversed shear tokamak equilibria 48<br />
<strong>1.</strong>4 FT3 Conceptual Study 50<br />
<strong>1.</strong>4.1 Introduction 50<br />
<strong>1.</strong>4.2 Main objectives of the FT3 scientific programme 50<br />
<strong>1.</strong>5 PROTO-SPHERA 52<br />
<strong>1.</strong>5.1 Introduction 52<br />
<strong>1.</strong>5.2 Mechanical engineering 53<br />
2. IGNITOR PROGRAM* 59<br />
2.1 Introduction 59<br />
2.2 Physics 59<br />
2.2.1 Advanced scenarios 59<br />
(*) Not in association framework
2.3 Engineering of the Machine 59<br />
2.3.1 EM analysis of vacuum vessel during plasma disruptions 59<br />
2.3.2 Engineering models 60<br />
2.3.3 Plasma-wall interaction and molybdenum contamination 61<br />
2.3.4 Auxiliary plasma heating system: ICRH 61<br />
3. FUSION TECHNOLOGY 65<br />
3.1 Technology Programme 65<br />
3.<strong>1.</strong>1 Introduction 65<br />
3.2 First Wall and Divertor 65<br />
3.2.1 Influence of manufacturing heat cycles on CuCrZr properties<br />
(ITER Task DV4/04) 65<br />
3.2.2 Manufacturing of small-scale W monoblock mockups by hot<br />
radial pressing (ITER EFDA R&D Tasks) 66<br />
3.2.3 Runaway electrons on ITER PFCs (EFDA Contract /00-520) 66<br />
3.3 Vacuum Vessel and Shield 67<br />
3.3.1 EM analyses of in-vessel components for ITER-FEAT 67<br />
3.3.2 ITER-FEAT breeding blanket 68<br />
3.4 Magnets 69<br />
3.4.1 Installation and testing of ITER CS and TF model coils<br />
(ITER Task M20) 69<br />
3.4.2 Development of calculation codes for CIC conductors<br />
(EFDA Task TWO-T400-1/01) 71<br />
3.4.3 New diagnostics for a CIC conductor (EFDA Task TWO-T400-1/01) 71<br />
3.4.4 Development of NbTi conductors for ITER PF coils<br />
(ITER Task M50, EFDA Task TWO-T405/1 and TW1-TMC/SCABLE) 72<br />
3.4.5 Test in SULTAN of the <strong>ENEA</strong> Nb3Sn magnet (ITER Task M20) 74<br />
3.4.6 Chemical deposition of oxide buffer layers for YBCO-coated<br />
metallic tapes 74<br />
3.4.7 Development of Nb 3 Al strands for high-field applications 74<br />
3.4.8 Feasibility study on eddy current testing of ITER coil case welds<br />
(ITER Task TW1-TMS/MMTFRD) 75<br />
3.5 Neutronics 75<br />
3.5.1 3-D nuclear analysis for ITER-FEAT design 75<br />
3.5.2 Experimental validation of shutdown dose rates for ITER 76<br />
3.5.3 Design of the neutron cameras for ITER 78<br />
3.5.4 Evaluation of neutron cross sections for fusion materials (EFF project) 79<br />
3.5.5 Neutronics benchmark experiment on SiC (EFF project) 79<br />
3.5.6 Experimental validation of neutron cross sections for fusion<br />
materials (EAF project) 80
3.6 Remote Handling 81<br />
3.6.1 IVROS articulated boom 81<br />
3.6.2 Upgrade of DRP heavy manipulator/crane/trolley 82<br />
3.6.3 Trials using ITER FDR 98 duct equipment in real remote conditions 82<br />
3.6.4 Installation, commissioning and trials with the CEA/Cybernetix MAESTRO<br />
radiation-hard servo-manipulator arm on DTP cassette toroidal mover 82<br />
3.6.5 High-discharge electrical tests of multilink attachment pin concept<br />
at CESI* 82<br />
3.6.6 Final DRP trials using ITER FDR 98 cassette mockup with multilink<br />
attachments 83<br />
3.6.7 In-vessel viewing and ranging 83<br />
3.7 Materials 83<br />
3.7.1 Compatibility of SiC f /SiC composites with Pb-17Li 83<br />
3.7.2 Microstructural investigation of radiation effects in RAFM<br />
steel by SANS 84<br />
3.7.3 Mechanical properties of RAFM steel-base material and joints 84<br />
3.7.4 Low-cycle fatigue of RAFM steel in water with additives 85<br />
3.7.5 Development of a low-activation brazing technique for SiC f /SiC<br />
composites 86<br />
3.7.6 Measurement of residual stresses using neutron diffraction techniques 87<br />
3.7.7 SiC/SiC ceramic composites as PFC material 87<br />
3.7.8 Mechanical characterisation of materials with miniaturised specimens 89<br />
3.8 Liquid Metal Technology and Hydrogen Effects on Materials 89<br />
3.8.1 Interaction between lead-lithium alloy and water in DEMO-relevant<br />
conditions (EU Task TTBA-5) 89<br />
3.8.2 Qualification of tritium permeation in Pb-17Li/gas 91<br />
3.8.3 Transport parameters and solubility of hydrogen in Pb-17Li 92<br />
3.8.4 Hydrogen permeability and embrittlement in EUROFER97 martensitic steel 92<br />
3.8.5 Water detritiation systems (EU Task TTBA-D02) 93<br />
3.8.6 Measurements of H/D diffusivity and solubility through tungsten<br />
and tungsten alloys in the range 600-800°C (ITER Task 436) 94<br />
3.8.7 Corrosion and mechanical tests on structural materials in flowing<br />
Pb-17Li (EU Task TTMS-003-D13) 94<br />
3.8.8 Interaction chemistry between Li 2 TiO 3 ceramic pebble bed and<br />
EUROFER97 in He+0.1% H 2 purge gas at 600°C 95<br />
3.8.9 Li 2 TiO 3 pebble reprocessing; recovery of 6 Li as Li 2 CO 3 96<br />
3.9 Thermal-Fluidodynamics 97<br />
3.9.1 Fatigue tests on six mockups of primary first-wall panel prototype<br />
(EFDA Contracts 00/529 and 00/533) 97<br />
3.9.2 HE-FUS3 experimental cassette of lithium-beryllium pebble beds 98<br />
(*) Not in association framework
3.10 International Fusion Material Irradiation Facility (IFMIF) 98<br />
3.10.1 Design and mockup tests of lithium jet target 98<br />
3.10.2 System safety analysis and shielding calculations 99<br />
3.10.3 Development of fast neutron diagnostics 100<br />
3.11 Fuel Cycle 100<br />
3.1<strong>1.</strong>1 Tritium recovery from tritiated water 101<br />
3.12 Safety and Environment, Power Plant Studies and Socio-Economics 102<br />
3.12.1 Occupational radiation exposure assessment for ITER-FEAT 102<br />
3.12.2 Validation of computer codes and models (EFDA Task SEA5) 102<br />
3.12.3 Plant safety assessment for ITER-FEAT 104<br />
3.12.4 Waste management 107<br />
3.12.5 Power Plant Conceptual Study 108<br />
3.12.6 European ITER site at Cadarache 110<br />
4. MISCELLANEOUS 113<br />
4.1 Development of CVD Diamond Detectors for Nuclear Radiation* 113<br />
4.2 Light Response of a Pure Liquid Xenon Scintillator* 113<br />
4.3 Partecipation in the agile Project: Collimator and Coded Mask of the<br />
Superagile Detector* 113<br />
4.4 Advanced Superconducting Materials and Devices* 114<br />
4.4.1 Ni-W based architectures: preliminary results 114<br />
4.4.2 Influence of the substrate on the YBCO-film transport properties 115<br />
4.4.3 Inclined substrate deposition of CeO 2 films on randomly<br />
oriented metallic substrate 115<br />
4.4.4 MgB 2 film fabrication 116<br />
4.5 Optical Metrology Survey 117<br />
4.6 New Hydrogen Energy* 118<br />
4.7 Cryogenic Testing of Diode Stacks for CERN* 119<br />
4.8 Cryogenics* 119<br />
4.8.1 Liquid helium service 119<br />
4.8.2 Cryogenic technologies 119<br />
5. INERTIAL CONFINEMENT 121<br />
5.1 Introduction 123<br />
5.2 Diagnostic Upgrading 123<br />
(*) Not in association framework
5.3 Theory 123<br />
5.3.1 Interaction of laser beams with multi-foil plastic structures 123<br />
5.3.2 Code COBRAN implementation 128<br />
5.3.3 DPSSL design activity 128<br />
PUBLICATIONS, CONFERENCES AND REPORTS 129<br />
Publications 131<br />
Articles in Course of Publication 136<br />
Contributions to Conferences 137<br />
Reports 141<br />
Conferences and Seminars 142<br />
ORGANISATION CHART 145<br />
ABBREVIATIONS AND ACRONYMS 147
<strong>ENEA</strong>’s activities in the field of controlled nuclear fusion form part<br />
of its overall mandate to conduct research on energy sources that<br />
have a low environmental impact and a high innovative content.<br />
There are two promising approaches to controlled nuclear fusion -<br />
<strong>magnetic</strong> <strong>confinement</strong> and inertial <strong>confinement</strong>. In the first approach,<br />
suitably configured high <strong>magnetic</strong> fields are used to contain the reacting<br />
plasma and limit energy loss. The second approach uses pulsed energy<br />
sources (lasers or particle beams, generally known as drivers) to<br />
compress the fuel and heat part of it to the critical temperature at which<br />
fusion reactions are triggered. The results achieved over the past two<br />
decades have convinced most researchers that it is now possible to<br />
proceed with experiments that demonstrate so-called thermonuclear<br />
ignition or, at least, a high ratio between the fusion energy generated and<br />
the energy required to produce the reacting configuration. Towards this<br />
end, large-scale projects are currently under design or already under<br />
way.<br />
PREFACE<br />
The Italian programme addresses both concepts but focuses mainly on<br />
<strong>magnetic</strong> <strong>confinement</strong> fusion. Italy accounts for 20% of the European<br />
Fusion Programme and is second only to Germany and slightly ahead of<br />
France. The EU through the European Fusion Programme leads the<br />
world in the field of <strong>magnetic</strong> <strong>confinement</strong> and, indeed, has<br />
demonstrated that a policy of close interaction and cooperation between<br />
centres of excellence within a framework of a common EU strategy is<br />
extremely gainful to all concerned.<br />
The most important experimental activities of <strong>ENEA</strong> are carried out<br />
on the Frascati Tokamak Upgrade (FTU) at the Frascati<br />
laboratories. FTU is a high <strong>magnetic</strong> field tokamak device<br />
dedicated to experiments on microwave plasma-heating. <strong>ENEA</strong> is also<br />
involved in experimental work on the Joint European Torus (JET) and<br />
collaborates in the design of the International Thermonuclear<br />
Experimental Reactor (ITER). The integrated nature of this global<br />
programme has generated extensive collaborations, in which the results<br />
and goals are shared, as well as competition between the participants to<br />
obtain the most significant tasks. <strong>ENEA</strong> has forged several national<br />
collaborations which involve experimental work on FTU. The main
partner in this respect, the Institute of Plasma Physics of the National<br />
Research Council (CNR) Milan, specialises in researching electron<br />
cyclotron resonance plasma heating. Other partners include the<br />
Reversed Field Experiment (RFX) Consortium (which operates the<br />
reversed field pinch device), the interuniversity CREATE Consortium<br />
and research teams from Turin Polytechnic and the Universities of<br />
Catania and Rome. Outside Italy, <strong>ENEA</strong> has carried out joint experiments<br />
on FTU with CEA, the John Hopkins University, the Lawrence Livermore<br />
National Laboratory and various Russian institutes.<br />
Technological R&D for <strong>magnetic</strong> fusion entails collaboration with<br />
Italian industrial partners (Ansaldo, Belleli, Edison, Europa<br />
Metalli, OECM, etc.) as well as universities in Italy and abroad<br />
(Turin Polytechnic, Universities of La Sapienza, Tor Vergata, Bologna,<br />
Dresden, Stanford) and research institutes (Commisariat à l’Energie<br />
Atomique France, Forschungswentrum Karlsruhe Germany, Centre de<br />
Recherches en Physique des Plasmas Switzerland).<br />
Inertial <strong>confinement</strong> fusion (ICF) is studied at the ABC laser facility at<br />
<strong>ENEA</strong> Frascati. The ABC, designed and built entirely at Frascati, is<br />
used for preliminary experiments on laser-matter interaction and<br />
studies on the resulting ablative acceleration. The ICF group’s experience<br />
and expertise in theory and modelling have also gone to make <strong>ENEA</strong><br />
Frascati one of the top non-military ICF research centres.<br />
PREFACE
<strong>1.</strong> MAGNETIC CONFINEMENT<br />
9<br />
<strong>1.</strong><strong>1.</strong>1 Introduction<br />
<strong>1.</strong>1 Tokamak Physics<br />
The main goal of the Frascati Tokamak Upgrade (FTU) scientific programme is to<br />
investigate transport, stability and radiofrequency physics issues at ITER-like<br />
plasma densities and <strong>magnetic</strong> field values.<br />
In 2001, the FTU lower hybrid system came close to delivering its maximum allowable<br />
(~2.4 MW) power. Up to 2.2 MW were injected into the plasma, with a level of 2.0 MW<br />
routinely achieved. During the 2001 experimental campaign it was, therefore, possible<br />
to study both current-drive and internal transport-barrier formation in high-density<br />
scenarios. In fact, collisional ion heating was observed at densities around 10 20 m -3 .<br />
Electron cyclotron resonance heating was used to explore heat transport and was<br />
combined with the injection of lower hybrid waves for synergy studies. Modulated<br />
electron cyclotron heating was also applied for the transport studies, which focussed on<br />
the issue of profile stiffness and the specific role of collisionality. As proposed at the 2001<br />
Frascati workshop (see below) on the FTU programme, a campaign is being planned to<br />
compare FTU results with those of other devices, such as ASDEX-Upgrade and Tore<br />
Supra.<br />
Steady pellet enhanced performance modes were extensively studied. Careful timing<br />
of the pellet sequence allowed a high degree of reproducibility to be achieved for<br />
these high-performance discharges. The experiments gave interesting information<br />
about the role of sawteeth with respect to impurity accumulation. A compromise<br />
seems possible, where the sawteeth are slowed down enough to achieve improved<br />
<strong>confinement</strong>, but can still prevent impurity accumulation and also produce an<br />
outward pinch that reduces central radiation. Results from preliminary experiments<br />
performed with pellets plus lower hybrid indicated that good radiofrequency<br />
coupling is possible at high field and density.<br />
Installation of the new boronisation system allowed a significant decrease in<br />
impurity contamination and radiated fraction. Consequently, it was possible to start<br />
studies on the radiative improved mode in the last part of the 2001 campaign.<br />
The new diagnostic for fast x-ray imaging, developed at Frascati, was installed on the<br />
National Spherical Tokamak Experiment. The device is based on a micro-pattern gas<br />
detector with a gas electron multiplier amplifier.<br />
A workshop was held at Frascati on 22-23 November 2001 to discuss the mediumterm<br />
FTU programme and to increase the participation of European laboratories in<br />
the machine. The workshop was organised in plenary and parallel brainstorming<br />
sessions, with each session chaired by an external participant. Forty people were<br />
from <strong>ENEA</strong> Frascati and the Consiglio Nazionale di Ricerca Milan and about thirty<br />
came from other labs (European, USA, Japanese and Russian). The discussions<br />
focused on areas where FTU can provide unique results. Several interesting<br />
proposals were made and are presently being considered for implementation.<br />
The contribution of <strong>ENEA</strong> to the C4 Joint European Torus campaign in 2001 amounted to<br />
about 1 ppy and was focussed on the activities of Task Forces S2 and H. Plasma<br />
configurations with internal transport barriers of long duration (11s≈30τ E ≈τ R , with τ E the<br />
energy <strong>confinement</strong> time and τ R the resistive diffusion time) were produced, thanks to the<br />
current profile control now possible with the lower hybrid system.<br />
<strong>1.</strong><strong>1.</strong>2 Experimental results<br />
Lower hybrid current drive and heating experiments at high density<br />
The lower hybrid (LH) radiofrequency (rf) system in FTU (six gyrotrons,
10<br />
<strong>1.</strong> MAGNETIC CONFINEMENT<br />
<strong>1.</strong>1 Tokamak Physics<br />
f LH =8 GHz, two antennas) has achieved 2.2 MW, corresponding to a net power<br />
density of 6.2 kW/cm 2 on the waveguide mouths, with an average reflection<br />
coefficient of 10%. With this level of power, current drive (CD) is being studied in the<br />
typical density range (i.e., at line-averaged density n _ e ≥1×10²⁰ m -3 ) of a reactor<br />
plasma.<br />
In 2001, work was focussed on 1) studies on collisional coupling between electrons<br />
and ions and on CD efficiency and 2) a way to establish and sustain internal<br />
transport barriers (ITBs). For 1) the studies were performed at plasma current I p =0.5<br />
MA and toroidal <strong>magnetic</strong> field B T ≤7.2 T so as to have<br />
good LH-wave accessibility in the plasma core. For 2),<br />
B T was in the useful range for the electron cyclotron<br />
heating (ECH) power available in FTU (f ECH =140<br />
GHz, P ECH up to 0.8 MW, B T =5.3 T for on-axis<br />
electron cyclotron resonance heating). The discharges<br />
run for the e - -i + coupling study exhibited complete<br />
stabilisation of sawtooth activity, with more than 75%<br />
of the current driven by the LH wave, an increase in<br />
electron temperature of more than 2 keV and an<br />
increase in the neutron yield of one order of<br />
magnitude. Figure <strong>1.</strong>1 shows the results for discharge<br />
#20026 (I p =0.5 MA, B T = 6 T). The line-averaged<br />
density at its maximum is <strong>1.</strong>0×10 20 m -3 . The fraction<br />
of driven current is estimated from V loop to be about<br />
0.3 MA, with an increase from <strong>1.</strong>8 to 3.8 keV in T e0 .<br />
The neutron yield increases by a factor of 7,<br />
corresponding to an increase from <strong>1.</strong>2 to <strong>1.</strong>55 keV in<br />
T i . Even with full stabilisation of the sawtooth, m=1<br />
activity persists. The launched N ⎟⎟<br />
spectrum is peaked<br />
at <strong>1.</strong>82.<br />
<strong>1.</strong>6<br />
<strong>1.</strong>4<br />
<strong>1.</strong>2<br />
1<br />
0.5<br />
0<br />
3.5<br />
3<br />
2.5<br />
2<br />
<strong>1.</strong>6<br />
<strong>1.</strong>4<br />
<strong>1.</strong>2<br />
1<br />
In a sawtooth-free plasma with weak or negative<br />
central <strong>magnetic</strong> shear (WS-NCS) [<strong>1.</strong>1], the onset of<br />
electron ITBs is generally indicated as a steep gradient in the electron temperature<br />
(here q is the safety factor and the shear s is defined as s=rq’/q). To achieve and<br />
sustain WS-NCS, it is necessary to break the “Ohmic” link between the electron<br />
temperature and the current density profiles. One way to do this is to drive a<br />
substantial fraction of the plasma current non-inductively and at the same time<br />
produce a WS-NCS discharge.<br />
MW keV keV V<br />
1012s-1 1020m-3<br />
0.5<br />
0<br />
2<br />
1<br />
0<br />
n e0<br />
V loop<br />
T e0<br />
T i0<br />
Neutrons<br />
P LH<br />
Fig. <strong>1.</strong>1 - Time evolution of<br />
main plasma quantities in<br />
a high-density LHCD<br />
discharge. Top to bottom:<br />
time traces of a) central<br />
electron density; b) loop<br />
voltage; c) central<br />
electron temperature; d)<br />
central ion temperature;<br />
e) neutron rate; f)<br />
coupled LH power.<br />
0.45 0.5 0.55 0.6 0.65 0.7<br />
Time (s)<br />
Wide electron ITBs were obtained in FTU at a density of up to n e0 ~0.9 10 20 m -3<br />
(n _ e ~0.6×10²⁰ m -3 ) by combining ECH and lower hybrid current drive (LHCD) both<br />
in full and in partial CD regimes. This shows that operations near the ITER density<br />
and B T ranges do not prevent electron ITBs from setting in. The LH waves in FTU<br />
control the current density profile j(r), driving a large part (sometimes all) of the<br />
plasma current and heating the electrons, whereas the EC waves are used as a very<br />
localised electron heating source at the resonance radius. The EC power is used<br />
either to take advantage of the improved <strong>confinement</strong> by heating the plasma inside<br />
the ITB or to enhance the peripheral LH power deposition and CD by setting the<br />
resonance radius off axis.<br />
[<strong>1.</strong>1] E. Barbato, Plasma<br />
Phys. Control. Fusion, 43,<br />
A287 (2001)<br />
Two successful scenarios were developed and studied. In the first, LH waves<br />
established full CD conditions and complete magnetohydrodynamic (MHD)<br />
stabilisation, prior to EC-wave injection. The wave was launched during the current<br />
flat-top, with the EC resonance located very close to the <strong>magnetic</strong> axis. In this way<br />
ITBs were obtained at both low (n _ e =0.3×10²⁰ m -3 ) and high (n _ e =0.6×10²⁰ m -3 )
MW 1012 s-1 keV MA<br />
<strong>1.</strong> MAGNETIC CONFINEMENT<br />
11<br />
<strong>1.</strong>1 Tokamak Physics<br />
[<strong>1.</strong>2] G. Tresset et al., A<br />
dimensionless criterion<br />
for characterizing internal<br />
transport barriers in<br />
JET, accepted for<br />
publication on Nucl. Fusion<br />
Fig. <strong>1.</strong>2 - Time evolution of<br />
main plasma quantities in<br />
an ITB discharge with<br />
LHCD in the current<br />
ramp-up phase and offaxis<br />
ECH power (I p =0.5<br />
MA, B T =5.5 T), compared<br />
with an Ohmic shot. Top<br />
to bottom: time traces of<br />
a) plasma current; b) lineaveraged<br />
density; c)<br />
central electron temperature;<br />
d) neutron yield; e)<br />
LH and ECH power.<br />
density. High central electron temperatures (T e0 >8 keV) were achieved at<br />
n _ e =0.3×10²⁰ m -3 , B T =5.3 T, I p =350 kA with P LH =0.6 MW and P ECH =0.35 MW. The<br />
q profile was not measured, but transport simulations [<strong>1.</strong>1] showed a <strong>magnetic</strong> shear<br />
reversal region at r/a≤0.35. At the border of this region, a large gradient developed,<br />
L T<br />
-1 =(dTe /dr)/T e =30 m -1 , corresponding to R/L T =28 (with R the major plasma<br />
radius). The local ρ T * =ρ/L T value (where ρ is the ion Larmor radius for T e =T i ) was<br />
≥ 0.03, which is double the ρ T * value considered in JET discharges as a threshold for<br />
an ITB [<strong>1.</strong>2]. At higher density, n _ e =0.6×10²⁰ m -3 (n _ e0 =0.9×10²⁰ m -3 ), T e0 (central<br />
electron temperature)=5.4 keV was achieved with P LH =<strong>1.</strong>7 MW, and P ECH =0.7 MW<br />
at B T =5.3 T, I p =460 kA. The neutron flux also increased by a factor of 2 from the<br />
Ohmic to the LHCD phase and reached a factor of 2.5 in the combined LH+ECH<br />
phase. According to the transport analysis, the WS/NCS region extended up to half<br />
radius because of a broad LH power deposition profile. At the border of this region<br />
(r/a~0.5) L T<br />
-1 =20 m -1 , corresponding to a local ρ T * , again larger than the JET<br />
threshold value. The current was not fully driven by LHCD. The residual V loop was<br />
≈0.4 V (fig. <strong>1.</strong>2), corresponding to a residual Ohmic power P OH ≈ 0.2 MW. As usually<br />
found with central ECH heating in conditions close to full LHCD, the hard x-ray<br />
profile emission remained unchanged during the whole heating phase, which<br />
indicates a stationary current density profile.<br />
1020 m-3<br />
0.5<br />
0<br />
0.5<br />
0<br />
5<br />
0<br />
0.2<br />
0<br />
2<br />
1<br />
I p<br />
n e<br />
T e0<br />
Neutrons<br />
0<br />
0 0.1<br />
P LH<br />
PECH<br />
0.2 0.3 0.4 0.5<br />
Time (s)<br />
In the second scenario,<br />
both ECH and LHCD were<br />
applied early on in the<br />
discharge, during the<br />
current ramp-up phase<br />
(dI p /dt=2 MA/s), to take<br />
advantage of any preexisting<br />
WS-NCS associated<br />
with initial non-relaxed<br />
j-profiles. The ECH was<br />
applied off axis, before<br />
LHCD (P ECH ≈0.3 MW,<br />
r dep /a=0.2), thereby<br />
broadening the initial<br />
temperature and possibly<br />
triggering an off-axis<br />
LHCD. Figure <strong>1.</strong>2 shows<br />
the time evolution of the<br />
main plasma quantities.<br />
The LH power was<br />
injected in 100 ms in steps<br />
of just over 0.3 MW up to<br />
<strong>1.</strong>7 MW to compensate for the increasing electron density. In this way an electron ITB<br />
(L T<br />
-1 =20 m -1 , ρ T * >0.03) was sustained for more than 0.2 s (6-7 <strong>confinement</strong> times) well<br />
inside the current flat-top. In this phase the driven current fraction was I LH /I p ~50%,<br />
the central density increased up to n e0 ~0.8×10 20 m -3 , T e0 exceeded 11 keV, the ITB<br />
footprint expanded from r/a~ 0.3 to ≈0.4 and T i0 went from 1 to <strong>1.</strong>6 keV. The neutron<br />
yield also increased during the main ITB phase and was three times larger than in a<br />
reference Ohmic discharge. The ITB was terminated at t>0.34 s by an m=1 MHD<br />
tearing mode related to a change in the current density profile after ECH switch-off.<br />
The local transport analysis showed that, in the weak shear region, transport is<br />
indeed reduced during the main heating. However, the low plasma volume still<br />
involved implies that the global energy <strong>confinement</strong> time is generally in line with the<br />
ITER89-P scaling, although it exceeds the ITERL-thermal scaling.
12<br />
<strong>1.</strong> MAGNETIC CONFINEMENT<br />
<strong>1.</strong>1 Tokamak Physics<br />
Energy transport and electron temperature profile stiffness with localised ECRH<br />
Off-axis ECRH clearly reveals electron temperature profile stiffness in FTU [<strong>1.</strong>3],<br />
particularly when absorption is located in the <strong>confinement</strong> region, i.e. outside the<br />
sawtooth inversion radius (r/a > 0.2) but inside the radiation-dominated periphery<br />
(r/a< 0.6). The typical marker of electron temperature profile stiffness, observed in<br />
all similar experiments on ASDEX-U, D III-D, Tore Supra and TCV, is a step in the<br />
radial dependence of the electron thermal diffusivity. The step is usually positioned<br />
at the EC-wave absorption radius, particularly when the ECRH power density<br />
greatly exceeds the Ohmic input. The step amplitude is just enough to keep the<br />
temperature profile smooth. The gradient length L T =T e /∇T e of the profile hardly<br />
changes from Ohmic heating to ECRH and is not influenced by ECRH intensity and<br />
localisation.<br />
Modulated ECH was applied to study electron temperature profile stiffness in FTU<br />
plasmas during current ramp-up. Modulated ECH experiments at current flat-top on<br />
ASDEX-UG [<strong>1.</strong>4] have shown that the heat wave propagates much faster outwards<br />
than inwards, confirming the step-wise behaviour of thermal diffusivity at the EC<br />
absorption radius. The experiments during current ramp-up were performed with<br />
ECRH at a much lower power level than Ohmic heating in order to limit as much as<br />
possible the impact of ECRH on profile shapes. In addition, target plasmas with very<br />
different shapes were obtained through control of the breakdown and density buildup<br />
phases. Figure <strong>1.</strong>3 shows two typical targets, one with peaked temperature (and<br />
current density) profiles, the other with flat-hollow profiles characterised by the<br />
occurrence of typical double tearing modes. Heat wave propagation is much more<br />
sensitive than power balance analysis to discontinuities in thermal conductivity. In<br />
addition, by looking at the amplitude and phase radial distribution of electron<br />
temperature oscillations, it can be excluded that the apparent drop in diffusivity is<br />
due mostly to a heat pinch.<br />
[<strong>1.</strong>3] S. Cirant et al., Proc.<br />
14 th AIP Conf. on Radio<br />
Frequency Power in<br />
Plasmas (Oxnard 2001),<br />
Vol. 595, p 338<br />
[<strong>1.</strong>4] F. Ryter et al., proc.<br />
28 th EPS Conf. on<br />
Controlled Fusion and<br />
Plasma Physics (Madeira<br />
2001), Vol. 25A, p. 685<br />
The experiments showed that in these conditions the low-high diffusivity transition<br />
layer is not strictly positioned at the absorption radius and that it depends to some<br />
extent on the profile shape. For a given position of the absorption layer (r/a≈0.25), in<br />
Te (keV)<br />
Te (keV)<br />
2.5<br />
2<br />
<strong>1.</strong>5<br />
1<br />
0.5<br />
0<br />
3<br />
2.5<br />
2<br />
<strong>1.</strong>5<br />
1<br />
0.05<br />
#20144<br />
#20146<br />
a)<br />
a)<br />
b)<br />
ρ ≈ 0.07<br />
r ≈ r dep ≈ 0.28<br />
P ECH<br />
0<br />
0.15 0.25 0.35 0.45<br />
Time (s)<br />
a)<br />
200<br />
100<br />
0<br />
200<br />
100<br />
PECH (kW)<br />
PECH (kW)<br />
Fig. <strong>1.</strong>3 - Evolution in time of a) electron temperature on axis and at the deposition radius; b) temperature<br />
profile for two discharges characterised by very different profile shapes. The heat wave is launched at the<br />
EC wave absorption radius, which is well inside the flat region for shot #20144 and in the steep region in for<br />
shot #20146.<br />
Te (keV)<br />
3.5<br />
3<br />
2.5<br />
2<br />
<strong>1.</strong>5<br />
1<br />
0.5<br />
t = 0.10 ÷ 0.17 s<br />
δt = 0.1 s<br />
#20144<br />
#20146<br />
0<br />
0.7 0.8 0.9 1 <strong>1.</strong>1 <strong>1.</strong>2 <strong>1.</strong>3<br />
R(m)<br />
b)
<strong>1.</strong> MAGNETIC CONFINEMENT<br />
13<br />
<strong>1.</strong>1 Tokamak Physics<br />
Fig. <strong>1.</strong>4 - Key elements<br />
showing consistency<br />
between critical gradient<br />
modelling and experimental<br />
data. The<br />
effective gradient length<br />
(open dots) saturates (at<br />
≈10) when a critical value<br />
derived from ETG<br />
turbulence (x) is<br />
exceeded (at r=5-7 cm).<br />
Both steady-state and<br />
transient thermal<br />
diffusivity switch from<br />
low to high values at<br />
almost the same radial<br />
position.<br />
[<strong>1.</strong>5] A. Jacchia et al.,<br />
Proc. 14 th AIP Conf. on<br />
Radio Frequency Power in<br />
Plasmas (Oxnard 2001),<br />
Vol. 595, p.342<br />
[<strong>1.</strong>6] G.T. Hoang et al.,<br />
Phys. Rev. Letts 12,<br />
125001 (2001)<br />
R/LT,e<br />
slow<br />
low χ e,hp<br />
#20145(0.140 − 0.160 s)<br />
heat wave<br />
fast<br />
high χ e,hp<br />
R/L T,e -experiment<br />
R/L T,e,crit = 5 + 10 s/q (T.S.)<br />
χ e (p.b.)<br />
χe (m 2 /s)<br />
the case of peaked discharges the<br />
narrow EC deposition occurs mostly<br />
in the high-diffusivity region, while<br />
for flat-hollow discharges it is<br />
located well inside the lowdiffusivity<br />
central volume. The step<br />
in diffusivity appears, therefore, to<br />
depend on the gradient profile<br />
shape, which is consistent with the<br />
assumption that the maximum<br />
temperature gradient length is<br />
limited below a critical value.<br />
In fact, the critical gradient length<br />
model gives a good description of<br />
most experimental findings on<br />
profile stiffness in steady state [<strong>1.</strong>5].<br />
The results of modulated ECH<br />
experiments on current ramp-up can be consistently included within this<br />
framework, as shown in figure <strong>1.</strong>4. Firstly, the plasma column appears to be divided<br />
in two regions, each with different <strong>confinement</strong> properties. Secondly, the radial<br />
position of the step in both transient and steady-state electron thermal diffusivity<br />
almost coincide. Thirdly, the low-high diffusivity transition layer is located where<br />
the effective gradient length, which decreases with increasing radius, stabilises<br />
around a critical value. All these features can be explained if it is assumed that<br />
electron thermal transport is enhanced in the plasma region where 1/L T exceeds a<br />
critical value 1/L T,c that depends on local plasma parameters.<br />
Assuming as the critical gradient length L T,c the value of the actual L T at the<br />
transition layer, data from different discharges can be correlated with the<br />
corresponding local <strong>magnetic</strong> shear, as also observed on Tore Supra [<strong>1.</strong>6]. FTU data<br />
show a dependence of L T,c on the s/q parameter very similar to Tore Supra, in spite<br />
of the different electron heating methods (ECRH for FTU, fast wave in the ion<br />
cyclotron frequency range for Tore Supra). This dependence is consistent with<br />
theoretical predictions based on electron temperature gradient turbulence.<br />
<strong>1.</strong><strong>1.</strong>3 Downshifted and upshifted experiments with ECRH in LHCD<br />
plasmas<br />
To increase CD efficiency, the EC wave can be injected on a LHCD sustained plasma<br />
by exploiting the suprathermal absorption mechanism. The presence of fast electrons<br />
generated by LH waves allows the cyclotron resonant frequency to be shifted up or<br />
down from the cold resonance, depending on the launched N ⎟⎟EC , the <strong>magnetic</strong> field<br />
and the fast electron distribution.<br />
In the downshifted configuration (B T in the range of 6.9 -7.2 T and the cold resonance<br />
outside the plasma), up to 80% of EC power absorption is observed, with increments<br />
in electron temperature (∆T~ 1 keV) and driven plasma current (up to ∆I p ~ 35 kA for<br />
a plasma with I p =350 kA, =0.5×10 20 m -3 ). Electron cyclotron power absorption<br />
results in a loop voltage drop and in an increase in fast electron energy. The EC<br />
power absorption is closely related to the fast electron tail density that corresponds<br />
to the absorbed LH power, and is in agreement with a linear model of suprathermal<br />
interaction of the EC wave.<br />
In preliminary experiments on the up-shift scheme, 700 kW of EC waves were<br />
injected with 30° of toroidal angle in plasma with LHCD (<strong>1.</strong>5–2 MW), resulting in
14<br />
<strong>1.</strong> MAGNETIC CONFINEMENT<br />
<strong>1.</strong>1 Tokamak Physics<br />
partial CD. The central field was varied in the range 4.8-5.2 T, with I p =400–600 kA<br />
and =0.5–0.8×10 20 m -3 . In line with theoretical predictions, the single-pass<br />
absorption was well localised, occurring only on the low-field side where the wave<br />
beam encounters (at r/a ≈0.5) the resonant fast electrons before it is fully absorbed<br />
by the bulk resonant layer. The resulting EC current produced a local modification of<br />
J(r), as observed from the reduced MHD activity and the widening of the fast<br />
electron bremsstrahlung emission profile. The increase in the driven current<br />
(∆I≥100kA) as calculated from the drop in loop voltage was larger than that<br />
calculated from theory. The resulting increase in CD efficiency was above the error<br />
bars and indicates a synergy process between the two waves.<br />
<strong>1.</strong><strong>1.</strong>4 MHD behaviour in improved <strong>confinement</strong> regimes and new<br />
phenomena by fast MHD analysis<br />
Discharges that exhibit improved <strong>confinement</strong> after pellet injection are characterised<br />
by a change in the central MHD behaviour [<strong>1.</strong>7, <strong>1.</strong>8]. The optimum condition is an<br />
increase in the sawtooth period to values (20-100 ms, the typical pre-pellet value<br />
being 5 ms) that are a significant fraction of the energy <strong>confinement</strong> time. The main<br />
parameter controlling the post-pellet period is the pre-pellet central temperature<br />
(fig. <strong>1.</strong>5), for a wide range of plasma densities and plasma currents. This dependence<br />
can be easily understood because pellet penetration is a strong function of electron<br />
temperature. If pellet ablation is completed well outside the q=1 surface, the<br />
sawtooth period barely changes. In the other extreme case, if part of the pellet is<br />
ablated inside the q=1 surface, the sawtooth is completely suppressed. In the<br />
intermediate case, the optimum condition is attained. Complete sawtooth<br />
suppression can give transient <strong>confinement</strong> improvement, but in this case impurity<br />
accumulation takes place and this can lead to central radiative collapse.<br />
The temperature dependence was exploited to attain controlled access to pellet<br />
enhanced performance. The pre-pellet temperature decreases with increasing<br />
density, and in a first stage gas puffing was used for control. Another method that<br />
proved more efficient at plasma currents I p >1 MA was based on pellet sequence<br />
timing: a first pellet was used to cool the plasma, and the timing of the second pellet<br />
was optimised to meet the optimum temperature in the subsequent re-heating phase.<br />
In addition to sawtooth period modification, pellet injection produced MHD<br />
phenomena of fundamental interest [<strong>1.</strong>9, <strong>1.</strong>10]. In particular, macroscopic structures<br />
with dominant m=1 poloidal mode number were observed to saturate at large<br />
amplitudes and to survive across sawtooth collapses for times exceeding the resistive<br />
diffusion period (fig. <strong>1.</strong>6).<br />
These structures were<br />
recognised as m=1<br />
120<br />
<strong>magnetic</strong> islands with a<br />
x<br />
very strong soft-x-ray<br />
100<br />
emission from the o-point<br />
region (fig. <strong>1.</strong>7). The nonlinear<br />
stability of these<br />
The sawteeth are stabilised<br />
80<br />
islands seems to be due to<br />
60<br />
x<br />
radiative cooling around<br />
the o-point. In the absence<br />
40<br />
of sawtooth reconnection,<br />
x<br />
locking of the m=1 was<br />
20<br />
observed in some cases.<br />
x<br />
x<br />
x x<br />
x x<br />
x<br />
This phenomenon was due<br />
x xx<br />
x x x<br />
x x x<br />
0<br />
to toroidal mode coupling. 1 <strong>1.</strong>5 2 2.5 3 3.5<br />
T e (keV)<br />
τst (ms)<br />
x<br />
x x x<br />
I p < 1 MA<br />
I p < 1 MA<br />
[<strong>1.</strong>7] E. Giovannozzi et al.,<br />
Proc. 28 th EPS Conf. on<br />
Contr. Fusion and Plasma<br />
Phys. (Madeira 2001), Vol.<br />
25A, p. 69<br />
[<strong>1.</strong>8] P. Buratti et al., Bull.<br />
Am. Phys. Soc. 46, 156<br />
(2001)<br />
[<strong>1.</strong>9] E. Giovannozzi et al.,<br />
Am. Phys. Soc. 46, 156<br />
(2001)<br />
[<strong>1.</strong>10] P. Buratti,<br />
Turbolenza e strutture<br />
non lineari coerenti in<br />
FTU, invited oral<br />
presentation, SIF,<br />
LXXXVII Congresso<br />
Nazionale (Milano 2001)<br />
Fig. <strong>1.</strong>5 - Sawtooth period<br />
just after pellet injection<br />
as a function of electron<br />
temperature.
<strong>1.</strong> MAGNETIC CONFINEMENT<br />
15<br />
Fig. <strong>1.</strong>6 - Time traces of<br />
soft-x-ray emission showing<br />
the coexistence of<br />
m=1 oscillations and<br />
sawteeth up to t=0.78 s.<br />
Slowing-down and locking<br />
occur afterwards. The<br />
temperature trace has<br />
very small oscillations,<br />
showing that x-ray<br />
modulation is due to<br />
impurity trapping inside<br />
the m=1 island. Oscillations<br />
in the <strong>magnetic</strong> coil<br />
signal are due to an m=2,<br />
n=1 mode being forced by<br />
the m=1 mode.<br />
r (m)<br />
0.15<br />
0.1<br />
0.05<br />
0<br />
−0.05<br />
−0.1<br />
−0.15<br />
−0.15 −0.1−0.05<br />
#18599 t = 0.812 s<br />
r (m)<br />
Fig. <strong>1.</strong>7 - Reconstruction<br />
of mode rotation by softx-ray<br />
emissivity in the<br />
poloidal section.<br />
Te (keV) Soft-X<br />
Soft-X<br />
T/S<br />
5<br />
0<br />
1<br />
0.5<br />
2.5<br />
2<br />
<strong>1.</strong>5<br />
1<br />
0.5<br />
50<br />
0<br />
-50<br />
SX@z = 0 cm<br />
#18106 B tor = 7.1 T I p = 081 MA<br />
SX@z = 10 cm<br />
Magnetic coils<br />
T e @ r = 0<br />
0.7 0.75 0.8 0.9<br />
Time (s)<br />
0.85<br />
<strong>1.</strong>1 Tokamak Physics<br />
In fact, the n=1, m=1<br />
seeded an n=1, m=2<br />
island that was strongly<br />
affected by wall braking.<br />
A fast MHD data<br />
acquisition system<br />
allowing a 2-MHz<br />
sampling rate has been<br />
installed. Several new<br />
phenomena have been<br />
observed with this<br />
system, such as fishbonelike<br />
events during highpower<br />
LH current drive,<br />
mode locking and high<br />
frequency modes.<br />
Fishbone-like events occur above a power threshold<br />
P LH ><strong>1.</strong>5 MW. The <strong>magnetic</strong> structure has a clear<br />
(m,n)=(1,1) signature on the Mirnov coil diagnostic and<br />
rotates in the electron dia<strong>magnetic</strong> direction. Hence,<br />
these events are believed to be caused by the fast<br />
electrons due to LH absorption.<br />
Mode locking often preceded a major plasma disruption.<br />
Locking of the (2,1) and (3,1) modes occurred where<br />
1000<br />
there was strong interaction with the mechanical<br />
structures (poloidal ring structures supporting the<br />
500 Mirnov coil system itself) in the vacuum vessel. The<br />
location changed with the change in position of these<br />
mechanical structures, suggesting that error fields alone<br />
0<br />
do not determine the lock position. The Mirnov coil<br />
0.1<br />
diagnostic system was removed at the end of 2001 to<br />
reduce the incidence of disruptions provoked by mode<br />
locking. At the same time, a new set of coils with a safer<br />
mechanical structure was prepared for installation during the shutdown at the end<br />
of 200<strong>1.</strong><br />
0 0.05 0.15<br />
2000<br />
1500<br />
The MHD data were acquired with 250-kHz sampling rates over the whole discharge<br />
for around 30 shots before the Mirnov coil diagnostic was removed. At the beginning<br />
of these discharges, MHD activity started with very high m~20 modes cascading<br />
down to m~10 in about 50 ms, with then a slower decay to m~4 in a time span of<br />
200 ms. These MHD modes all rotated in the electron dia<strong>magnetic</strong> direction, while<br />
the background broadband “noise” rotated in the ion dia<strong>magnetic</strong> direction at<br />
apparently high (m,n) numbers. In some of these discharges, a large (2,1) mode<br />
appeared in the current plateau and, after increasing to large amplitudes of ~1%,<br />
locked until the end of the discharge. However, no disruption occurred over this<br />
period of 1 s or more. During the growth and slowing down of the (2,1) mode,<br />
another mode with (4→5,2) structure appeared at a much higher frequency (fig. <strong>1.</strong>8).<br />
Whereas the (2,1) mode started at around 5 kHz and slowed down to 0 kHz, the (4,2)<br />
mode started at 42 kHz and spun up to 50 kHz. This all suggests that, during the<br />
slowing down and locking of the (2,1) mode, changes occurred in the radial profile<br />
of the radial electric field, which were perhaps due to plasma interaction with the<br />
mechanical structures that act as limiters.
16<br />
<strong>1.</strong> MAGNETIC CONFINEMENT<br />
<strong>1.</strong>1 Tokamak Physics<br />
Table <strong>1.</strong>I - FTU record discharges<br />
Shot B I n T 0 Neutrons τ E H89P H97P n 0 T 0 τ e<br />
[T] [MA] [10 20 m -3 ] [keV] [10 13 s -1 ] [ms] ( 10 19 m -3 keV/sec<br />
11612 66 00.7 2.1 <strong>1.</strong>5 0.2 80 <strong>1.</strong>6 <strong>1.</strong>0 0.4<br />
12744 77 00.8 3.0 <strong>1.</strong>3 0.5 90 <strong>1.</strong>6 <strong>1.</strong>2 0.9<br />
18598 88 <strong>1.</strong>02 4.0 <strong>1.</strong>4 <strong>1.</strong>3 80-100 <strong>1.</strong>4-<strong>1.</strong>7 <strong>1.</strong>0-<strong>1.</strong>2 <strong>1.</strong>0<br />
<strong>1.</strong><strong>1.</strong>5 Pellet injection<br />
The main performances<br />
obtained with multiple<br />
pellet injection are<br />
summarised in table <strong>1.</strong>I. At<br />
8T, up to 5 pellets were<br />
fired into a single discharge<br />
at time intervals of 100 ms<br />
so as to cover the entire<br />
duration of the current flattop<br />
[<strong>1.</strong>11]. The preliminary<br />
results reported last year<br />
have been confirmed and<br />
high-performance pellet<br />
discharges have become a<br />
reliable and reproducible<br />
scenario of FTU operation.<br />
This has allowed a deeper<br />
investigation into associated<br />
transport phenomena,<br />
with the inclusion of<br />
particle and impurity<br />
<strong>confinement</strong>.<br />
f(kHz)<br />
60<br />
40<br />
20<br />
60<br />
40<br />
20<br />
60<br />
40<br />
20<br />
δB/B ||<br />
Spectrum #20504; :4S310P Range: 10 ->1E-3%, Max: 0.100<br />
0.0 0.2 0.4 0.6 0.8 <strong>1.</strong>0 <strong>1.</strong>2 <strong>1.</strong>4<br />
m-number port 1, level:-100 Range: 4 ->-4 Max: 19 Min:-13<br />
0.0 0.2 0.4 0.6 0.8 <strong>1.</strong>0 <strong>1.</strong>2 <strong>1.</strong>4<br />
m-number port 1, level:-100 Range: 7 ->-7 Max: 34 Min:-33<br />
0.0 0.2 0.4 0.6 0.8 <strong>1.</strong>0 <strong>1.</strong>2 <strong>1.</strong>4<br />
δn e (m-3)<br />
#18598<br />
In all cases, improved <strong>confinement</strong><br />
is associated with the suppression<br />
NGPS abl. code<br />
or stabilisation of sawtooth activity: 2<br />
post-pellet fast reheating combined<br />
axis<br />
with slow density decay increases<br />
the plasma energy content, while<br />
the Ohmic input power stays <strong>1.</strong>5<br />
around the pre-pellet level. Total<br />
sawtooth suppression seems to<br />
occur when the q=1 surface leaves<br />
the plasma. Both suppression and<br />
1<br />
0.9 1 <strong>1.</strong>1 <strong>1.</strong>2<br />
slowing down of sawtooth activity<br />
R(m)<br />
takes place only if the pellets<br />
penetrate deeply enough. On a short time scale (~100µs), particles are rapidly<br />
transported well beyond the pellet penetration point, as predicted by a neutral gas<br />
and plasma shielding (NGPS) code and confirmed by fast ECE measurements under<br />
an adiabatic assumption (fig <strong>1.</strong>9). Asymmetries in the temperature profile during the<br />
ablation process suggest the interaction of deposited matter with the m=1 <strong>magnetic</strong><br />
structures already present. After the end of the ablation, the central density decay<br />
δne(1020 m-3)<br />
2.5<br />
Time (s)<br />
0.05<br />
10<br />
10<br />
10<br />
10<br />
10<br />
4<br />
2<br />
0<br />
−2<br />
−4<br />
−2<br />
−3<br />
−4<br />
−5<br />
−6<br />
6<br />
4<br />
2<br />
0<br />
−2<br />
−4<br />
−6<br />
Fig. <strong>1.</strong>8 - MHD spectrograms<br />
showing mode<br />
amplitudes, toroidal (n)<br />
number and poloidal (m)<br />
number.<br />
Fig. <strong>1.</strong>9 - Particle<br />
deposition derived from<br />
fast ECE (nT=cost) at 50,<br />
100 and 150 µs from<br />
ablation start. Results of<br />
NGPS simulation.<br />
[<strong>1.</strong>11] D. Frigione et al.,<br />
Nucl. Fusion 41, 1613<br />
(2001)
<strong>1.</strong> MAGNETIC CONFINEMENT<br />
17<br />
<strong>1.</strong>1 Tokamak Physics<br />
Fig. <strong>1.</strong>10 - #12744.<br />
Particle fluxes integrated<br />
on the 0.16 m flux<br />
surface: a) neoclassical<br />
diffusion; b) neoclassical<br />
diffusion minus Ware<br />
pinch; c) experimental.<br />
<strong>1.</strong>5<br />
time is longer than a neoclassical<br />
Particle flux at r = 0.16 m<br />
prediction that includes the Ware<br />
pinch. Figure <strong>1.</strong>10 shows that across<br />
the r=16 cm surface, where no particle<br />
a)<br />
1<br />
source can be present after ablation,<br />
the experimental particle losses are<br />
b)<br />
lower than the net computed<br />
neoclassical flux. If the neoclassical<br />
0.5<br />
value is regarded as a lower limit for<br />
c)<br />
radial diffusivity, an anomalous<br />
inward pinch is required to explain<br />
the experimental observation.<br />
0<br />
0.60<br />
0.65<br />
0.70<br />
The plasma impurity content plays an<br />
Time (s)<br />
important role in the evolution of the<br />
discharge after strong pellet perturbation [<strong>1.</strong>12]. In some cases, hollow temperature<br />
profiles are produced, usually leading to a major disruption when a further pellet is<br />
injected. This happens when the density is raised close to a critical value determined<br />
by the power balance between Ohmic heating and radiation losses from<br />
molybdenum, at the plasma centre This criterion made it possible to prepare a<br />
suitable target for the injection of a given number of pellets. Further investigation of<br />
impurity control and the effect of additional heating is in progress. In 2002 another<br />
injector is going to be installed in collaboration with Padua RFX in order to have also<br />
a high-field-side pellet injection track. This should allow first-time studies on the<br />
effect of the particle radial drift at high density and high field in view of an<br />
extrapolation to ITER.<br />
1021 s-1<br />
<strong>1.</strong><strong>1.</strong>6 Boronisation: plasma results<br />
[<strong>1.</strong>12] D. Frigione et al.,<br />
Proc. 28 th EPS Conf. on<br />
Control. Fusion and Plasma<br />
Phys, (Madeira 2001), Vol.<br />
25A, p. 73<br />
[<strong>1.</strong>13] M.L. Apicella et al.,<br />
Proc. 27 th EPS Conf. on<br />
Control. Fusion and Plasma<br />
Physics (Budapest 2000),<br />
Vol. 24B, p. 1573<br />
The boronisation system for overcoming the problem of high Z eff values at low<br />
electron density was tested for the first time in FTU in October 200<strong>1.</strong><br />
Regarding vacuum performance, the getter action of boron on low-Z impurities<br />
causes a strong reduction (up to a factor of 2.5) in the overall degassing rate and in<br />
the pressure limit, which is reduced by a factor of <strong>1.</strong>7 after 1-2 days of operation<br />
following a fresh boronisation. This condition lasts for a long time (≥ 300 discharges).<br />
After boronisation, restart of operations as well as recovery from plasma disruptions<br />
are immediate and are a strong indication of the reduction in light impurities.<br />
Regarding plasma characteristics, there are two main results: for an Ohmic plasma<br />
(n _ e ≤<strong>1.</strong>0×1020 m -3 ), the total radiated power typically drops from 70-90% to 35-40%,<br />
and for I p =0.5 MA and n _ e =0.3−0.4×10²⁰ m -3 , Z eff decreases from 6.0 to 2.2 (see<br />
fig. <strong>1.</strong>11). These results are due to the strong decrease in heavy-metal concentrations<br />
(up to a factor of 5 for molybdenum) and to the getter action of boron on light<br />
impurities (oxygen concentration in the plasma is reduced from 2.5% to 0.5% and the<br />
carbon flux from the walls drops from <strong>1.</strong>0x10 18 to <strong>1.</strong>1x10 17 part/s/m 2 ).<br />
However, an unfortunate consequence of boronisation with cold walls is that it is<br />
difficult to control the plasma density during the first two days of operation (about<br />
60 discharges). The wall can either pump or release a large amount of H, depending<br />
on the saturation degree of the surfaces facing the plasma. This is similar to what has<br />
been observed after strong titanisation [<strong>1.</strong>13]. These phenomena do not occur in<br />
other tokamaks, which operate at high wall temperature (>150°C), because hydrogen<br />
is pumped by the B film during a pulse and then released immediately after it.<br />
Preliminary observations suggest that high recycling or high edge neutral density<br />
could hinder ITB formation in FTU.
18<br />
<strong>1.</strong> MAGNETIC CONFINEMENT<br />
<strong>1.</strong>1 Tokamak Physics<br />
Another result of boronisation is<br />
that hydrogen particles released<br />
from the B film dilute the plasma.<br />
The ratio of deuterium to hydrogen<br />
+ deuterium fluxes, as measured by<br />
the neutral particle analyser, can be<br />
as low as 40% after a fresh<br />
boronisation, despite pure D 2<br />
puffing. The ratio then increases<br />
slowly to 85% after about 200<br />
discharges. The D-dilution, in turn,<br />
reduces the plasma performance in<br />
terms of neutron yield. The target<br />
plasma used for pellet injection<br />
(n _ e =<strong>1.</strong>7×1020 m -3 ) shows a much<br />
lower radiated power than before<br />
boronisation (P rad /P tot ≈35%<br />
against 65% and Z eff ≈1 against<br />
Z eff ≈<strong>1.</strong>4), but the neutron rate<br />
decreases by up to a factor of 5. This<br />
decrease is in good agreement with<br />
simulations performed with the<br />
EVITA transport code [<strong>1.</strong>14]. The<br />
same code also shows that neither<br />
the electron nor the ion transport<br />
coefficients show any significant<br />
difference after boronisation.<br />
Zeff Prad/Pohm(%) ne(x10 19 m -3 )<br />
The best plasma performance<br />
0.0 0.5 <strong>1.</strong>0 <strong>1.</strong>5<br />
following boronisation was<br />
Time (s)<br />
achieved only after about 100<br />
discharges, when the boron had<br />
been eroded by the limiter but was still present on the chamber walls. The metal<br />
influx was lower than before boronisation because physical sputtering by oxygen<br />
ions and atoms was strongly reduced, and it was possible to control the edge<br />
temperature with D 2 gas puffing. For I p =0.5 MA and (n _ e =0.4×10²⁰ m -3 ), low oxygen<br />
(0.4%), molybdenum (0.1%) and iron (0.09%) concentrations were present in the<br />
plasma with Z eff =3.0 and a total radiated power close to 65% of the input power.<br />
During this phase, the reduction in Z eff allowed one of the best performances of FTU<br />
to be reached in terms of the actual CD efficiency η CD . Full CD with η CD =0.2x10 20<br />
Am -2 /W was obtained on a plasma target with I p =360 kA, B T =5.3 T, n _ e =0.4×10²⁰<br />
m –3 ) and P LH =<strong>1.</strong>5 MW, with only a small increase (from <strong>1.</strong>5 to 2.2) in Z eff . With the<br />
same plasma target, additional power P LH+EC =2.6 MW was coupled to the plasma<br />
with Z eff =3.0, compared to 6.0 before boronisation, at lower power. Very good highdensity<br />
plasmas were also obtained. With gas puffing, the density limit at I p =<strong>1.</strong>1 MA,<br />
B T =7.2 T reached, with gas puffing only, n e =3×10 20 m -3 . By reducing the radiated<br />
power, the boronisation technique has made it possible to study the so-called<br />
radiative improved mode plasmas at higher densities than those of TEXTOR [<strong>1.</strong>15].<br />
Neon is used as the injection gas until a fraction of 90% of the radiated power is<br />
achieved, with a subsequent peaking of the density profile and an increase in the<br />
neutron yield. In this case, no significant difference was found between the fresh and<br />
old boronisation. The relative neutron rate production increases by a factor of 3-4 in<br />
both cases, but the starting level after a fresh boronisation is about five times lower<br />
due to H dilution. To overcome the problem of H dilution and hopefully to exceed<br />
5<br />
4<br />
3<br />
2<br />
1<br />
100<br />
80<br />
60<br />
40<br />
20<br />
12<br />
10<br />
8<br />
6<br />
4<br />
2<br />
0<br />
Fig. <strong>1.</strong>11 - a) Line-averaged<br />
density; b) ratio of<br />
radiated to Ohmic power;<br />
c) Z eff for two Ohmic<br />
discharges at I p =0.5 MA:<br />
(blue) before boronisation<br />
and (red) after boronisation.<br />
[<strong>1.</strong>14] V. Zanza.<br />
http://efrw0<strong>1.</strong>frascati.<br />
enea.it/Software/Unix/F<br />
TUcodici/evita<br />
[<strong>1.</strong>15] B. Unterberg et al.,<br />
J. Nucl. Mater. 266-269,<br />
75 (1999)
<strong>1.</strong> MAGNETIC CONFINEMENT<br />
19<br />
the neutron production of the best FTU performances, deuterate diborane (B 2 D 6 ) is<br />
going to be used as the working gas in the near future.<br />
<strong>1.</strong><strong>1.</strong>7 Radiative improved mode in Ohmic plasmas<br />
<strong>1.</strong>1 Tokamak Physics<br />
In many tokamaks, controlled injection of gas impurities (mainly noble gases such as<br />
Ne, Ar and Kr) into the plasma has been found to lead, in certain conditions, to an<br />
improved <strong>confinement</strong> regime, the so-called radiative improved (RI) mode. The<br />
interest in this regime for FTU lies in the fact that it can be obtained with different<br />
<strong>magnetic</strong> configurations (circular or elongated plasmas, limiter or divertor) and<br />
different heating systems (neutral beam injection, ICRH and Ohmic). Moreover, it<br />
couples good energy <strong>confinement</strong> with a large fraction of radiation losses (up to 90%<br />
of total input power), thus alleviating the problems of plasma-wall interactions. Of<br />
course the price to be paid is a larger Z eff and greater plasma dilution.<br />
[<strong>1.</strong>16] M.Z. Tokar et al.,<br />
Plasma Phys. Control.<br />
Fusion 41, B317 (1999)<br />
[<strong>1.</strong>17] M. Bessenrodt-<br />
Weberpals et al., Plasma<br />
Phys. Control. Fusion 34,<br />
443 (1992)<br />
The strategy to look for the RI mode in FTU is based on the interpretation given by<br />
TEXTOR [<strong>1.</strong>16]: impurity injection attenuates the growth rate of the ion temperature<br />
gradient (ITG) instability. This leads to a smaller particle outflow and hence to<br />
peaking of the density profile. As a consequence, ITG turbulence is further<br />
attenuated, or even quenched. In cases where ITG turbulence is the dominant heatloss<br />
mechanism, an increase in energy <strong>confinement</strong> is achieved. In addition, it has<br />
been found that in TEXTOR the energy <strong>confinement</strong> time increases with density.<br />
An experimental campaign was started at FTU at the end of 2001 to explore the<br />
possibility of a RI mode in Ohmically heated plasmas. The aim was to reproduce the<br />
improved Ohmic <strong>confinement</strong> (IOC) regime of ASDEX. [<strong>1.</strong>17]. The plasma target was<br />
chosen so as to clearly see this regime, if it really did exist in FTU. At <strong>magnetic</strong> field<br />
B T =6 T, the plasma current was programmed to be at 0.8-0.9 MA to avoid the<br />
insurgence of MARFEs. The operational density was set at 10 20 m -3 in order to be<br />
well into the saturated Ohmic <strong>confinement</strong> (SOC) regime, where energy <strong>confinement</strong><br />
is independent of density. In FTU the critical density to access SOC is ~0.8 10 20 m -3 .<br />
Deuterium gas puffing was interrupted at 0.45 s, just at the beginning of the current<br />
flat–top, according to the experience on ASDEX. A neon puff (10-30 ms duration)<br />
was injected at 0.6 s, just at the beginning of the current flat–top.<br />
The standard FTU diagnostics was used to obtain the experimental results.<br />
Fig. <strong>1.</strong>12 - a) Lineaveraged<br />
density; b) Z eff<br />
from bremmstrahlung; c)<br />
radiated power; d)<br />
neutron yield for a<br />
discharge without Ne<br />
(red) and with Ne (violet)<br />
puffing of 20 ms at 0.6 s.<br />
1012 (s-1) 105 (W) Zeff 1019 (m3)<br />
10<br />
5<br />
3.5<br />
3<br />
2.5<br />
2<br />
<strong>1.</strong>5<br />
10<br />
5<br />
1<br />
0.5<br />
a)<br />
b)<br />
c)<br />
d)<br />
x<br />
x<br />
0<br />
0 0.5<br />
1<br />
Time (s)<br />
x<br />
x<br />
x<br />
x<br />
x<br />
x<br />
x<br />
x<br />
01<br />
02<br />
03<br />
04<br />
x<br />
Figure <strong>1.</strong>12a shows the<br />
central line-averaged<br />
density for a discharge<br />
with a Ne puff of 20 ms<br />
compared to a reference<br />
discharge without Ne.<br />
Two different phases<br />
can be seen: First, there<br />
is a slow increase in<br />
density after Ne<br />
injection, which cannot<br />
be fully accounted for<br />
by the electrons<br />
contributed by Ne<br />
ionisation. The Ne<br />
concentration can be<br />
roughly derived from<br />
the variation in Z eff<br />
(fig. <strong>1.</strong>12b). Radiation
20<br />
<strong>1.</strong> MAGNETIC CONFINEMENT<br />
<strong>1.</strong>1 Tokamak Physics<br />
power losses increase and<br />
reach 90% of the total<br />
power (fig. <strong>1.</strong>12c). At the<br />
end of the pulse the<br />
density abruptly increases<br />
at a stronger rate, up to a<br />
disruption. Neutron yield<br />
(fig. <strong>1.</strong>12d) increases by a<br />
factor of ~2 after the Ne<br />
puff.<br />
Figure <strong>1.</strong>13 shows the<br />
total plasma energy,<br />
calculated assuming<br />
T i =T e , and the Ohmic<br />
power for the two<br />
discharges. Since at<br />
equivalent Ohmic power<br />
the thermal energy is<br />
larger for the Ne-puffed<br />
10-2 (s) 106 (W) 104 (J)<br />
6<br />
4<br />
2<br />
0<br />
<strong>1.</strong>5<br />
1<br />
0.5<br />
0<br />
5<br />
4<br />
3<br />
2<br />
1<br />
a)<br />
b)<br />
c)<br />
0 0.5<br />
1<br />
Time (s)<br />
shot, an increase in <strong>confinement</strong> time is derived. Density profiles are more peaked<br />
after the Ne puff, while the electron temperature remains the same or even increases<br />
a bit. To get more accurate values of these parameters requires simulation with a<br />
transport code. The later, sudden density increase in the discharge with Ne is still<br />
unexplained and is being analysed. A preliminary conclusion is that this regime has<br />
all the signatures of a typical RI mode. A dedicated experimental campaign is to be<br />
carried out next year to compare this improved regime with those observed in other<br />
tokamaks.<br />
x<br />
x<br />
x<br />
x<br />
x<br />
x<br />
x<br />
x<br />
x<br />
x<br />
x<br />
01<br />
02<br />
03<br />
Fig. <strong>1.</strong>13 - a) Total<br />
thermal energy (T i =T e );<br />
b) Ohmic power; c)<br />
energy <strong>confinement</strong> time<br />
for a discharge without<br />
Ne (red) and with Ne<br />
(violet).<br />
<strong>1.</strong><strong>1.</strong>8 Fast x-ray imaging of the NSTX plasma by a micro-pattern gas<br />
detector with a GEM amplifier<br />
A new diagnostic device in the soft x-ray range has been developed at <strong>ENEA</strong> Frascati<br />
for imaging of <strong>magnetic</strong> fusion plasmas. It is a pinhole camera with a micro-pattern<br />
gas detector (MPGD) and a gas-electron multiplier (GEM) as the amplifying stage. A<br />
readout board with 144 pixels (12×12) was designed and coupled to the GEM<br />
detector, which has a 2.5×2.5 cm active area. The electron signal, corresponding to the<br />
detected x-ray photon, is collected at the pixel and processed by a fast charge preamplifier<br />
(LABEN 5231) and an amplifier (LABEN 5185). The data acquisition<br />
system, carried out in VME standard by CAEN, is formed of discriminators and<br />
counters for a total of 144 channels. The fast, low-noise electronics coupled to the<br />
discriminators and asynchronous scalers ensure high-quality data that has only<br />
statistical noise and single-photon counting at high rates of up to 10 7 ph/s×pixel and<br />
high frame rates of up to 100 kHz.<br />
The spatial resolution and imaging properties of the detector, fully illuminated by<br />
very intense x-ray sources (laboratory tube and tokamak plasma) and under the<br />
conditions of high counting rates and high gain, are reported in a previous work<br />
[<strong>1.</strong>18].<br />
[<strong>1.</strong>18] D. Pacella et al.,<br />
Rev. Sci. Instrum. 72,2,<br />
1372 (2001)<br />
The system was successfully tested at FTU with a 1-D perpendicular view of the<br />
plasma. It was then installed and used at the National Spherical Tokamak<br />
Experiment (NSTX) with a full 2-D tangential view, in the framework of a<br />
collaboration between <strong>ENEA</strong>, Princeton Plasma Physics Laboratory and John<br />
Hopkins University.
<strong>1.</strong> MAGNETIC CONFINEMENT<br />
21<br />
<strong>1.</strong>1 Tokamak Physics<br />
Detector parameters<br />
The gas mixture used for the MPGD is 80% Ne and 20% dimethyl ether. For the<br />
specific application, the operational voltages of the chamber are determined by two<br />
requirements: an energy range of 3– 8 keV and very high counting rates. The lower<br />
limit in energy is related to the present experimental set-up, i.e., a thick beryllium<br />
window on the tokamak and air between the window and the detector. In future this<br />
limit will be further lowered. The voltage differences are 600 V for the induction gap<br />
and 480 V for the gem foil; the drift cathode is polarised to 3000 V. The printed circuit<br />
board is grounded and all the applied voltages are negative.<br />
The energy calibration was performed with a 10-kV x-ray tube. The gain of the<br />
electronic amplifier of each pixel (144) was adjusted to reproduce the same spectrum,<br />
with a precision of about 2%. Since each channel (144) behaves as an independent<br />
spectrometer, this fine calibration is needed to get the same spectral response in<br />
order to exploit the combination of imaging capability and energy discrimination,<br />
which is one of the most powerful features of this system. The energy resolution of<br />
the detector in this range of energy is about 20%, so the electronic discrimination of<br />
the pulse amplitude can be sharp (with 20% uncertainty). The resolution can also be<br />
changed dynamically during the shot.<br />
Results on NSTX<br />
Fig. <strong>1.</strong>14 - 2-D x-ray image<br />
superimposed on the<br />
reconstruction of the<br />
<strong>magnetic</strong> surfaces of<br />
NTSX for shot #107332.<br />
The 2-D image obtained by the detector was superimposed on the EFIT-code<br />
reconstruction of the <strong>magnetic</strong> surfaces of NSTX for shot #107332 (fig. <strong>1.</strong>14). The<br />
detector view of the plasma for this shot is about 80 cm×80 cm. It is evident that the<br />
spatial distribution of the photon counts, represented by different colours, is in good<br />
agreement with the plasma <strong>magnetic</strong> reconstruction, despite the fact that the<br />
tangential view in a spherical tokamak integrates over a large part of the plasma.<br />
This 2-D image of the cross section<br />
of the plasma core is very clear<br />
because of the energy<br />
discrimination capability of this<br />
device. The effect of integration of<br />
the plasma emissivity along the<br />
line of sight, is indeed, strongly<br />
reduced because the photons were<br />
selected in the range 3-8 keV<br />
(central electron temperature no<br />
higher than 1 keV) and therefore<br />
all the photons emitted outside the<br />
central core are neglected.<br />
The time histories of the camera<br />
pixels were studied in different<br />
plasma conditions and the results<br />
compared with those of other<br />
diagnostics. At the beginning of<br />
the discharge (1-kHz sampling),<br />
the minimum counts/pixel<br />
needed to recognise the core<br />
structure is about 20; the<br />
maximum counts/pixel, when<br />
H–mode appears and neutral<br />
beam power reaches the<br />
maximum, is about 5000. The
22<br />
<strong>1.</strong> MAGNETIC CONFINEMENT<br />
<strong>1.</strong>1 Tokamak Physics<br />
noise of the detector is no more<br />
than 5 counts/pixel. Therefore the<br />
signal-to-noise ratio at the highest<br />
emissivity can be estimated to be<br />
about 1000 and the dynamic range<br />
of the system to be about 300. The<br />
maximum counting rate per pixel,<br />
before saturation, is 10 7<br />
ph/s×pixel.<br />
The capability to get very clear<br />
images of the core can also be<br />
observed during MHD instability.<br />
The time history of a few central<br />
pixels, in the presence of sawteeth,<br />
exhibits strong oscillations, while<br />
the central lines of sight of a<br />
vertical and horizontal<br />
perpendicular array of x-ray<br />
diodes show just weak<br />
modulations. This is related partly<br />
to the effect of integration along<br />
the line of sight and the energy<br />
discrimination of the MPGD<br />
system and partly to the tangential<br />
view of the pinhole camera.<br />
Fig. <strong>1.</strong>15 - A high<br />
acquisition frame rate<br />
(50 kHz) showing the<br />
capability of the<br />
diagnostics and the<br />
negligible influence of<br />
statistical noise.<br />
The time history of the whole plasma discharge can be acquired at a frame rate of<br />
10 kHz. Higher acquisition rates, up to 1 MHz, can be set for shorter time intervals.<br />
Increasing the rate reduces the counts per pixel and increases the statistical noise. A<br />
reasonable limit is 100 kHz, where the statistic is still acceptable. Figure <strong>1.</strong>15 shows<br />
a frame with a 50-kHz acquisition rate. The plasma core exhibits the same shape,<br />
despite the lower statistic, when compared with a frame acquired at 1 kHz, 2 ms<br />
before the switch from 1 to 50 kHz (shot #107356).<br />
In shot #107316, a phase of lack of <strong>confinement</strong> (normalised beta drops from 4 to 2)<br />
lasting about 20 ms was observed with 10-kHz frame rates. The x-ray image of the<br />
plasma cross section shows apparent poloidal rotations in the electron dia<strong>magnetic</strong><br />
direction, with a period of about 400 µs, and the loss of energy from the core is clearly<br />
related to these rotations.<br />
As the system is a pinhole camera, it has the flexibility and versatility of an optical<br />
device. It is, therefore, easy to change the magnification of the plasma image or the<br />
line of sight of the view to study off-centre plasma. The x-ray emission has been<br />
filmed from many different views off centre and at different magnifications.<br />
<strong>1.</strong><strong>1.</strong>9 JET<br />
<strong>ENEA</strong> Frascati contribution to JET Activity<br />
The contributions (about 0.9 ppy) of the <strong>ENEA</strong> Frascati group to the activities of Task<br />
Forces H, S2 and M in the one JET experimental campaign (C4) of 2001 were focussed<br />
on the areas of data analysis (about <strong>1.</strong>5 ppy) and scientific coordination of the C4<br />
experiments reported below.<br />
• Task Force H experiments aimed at maximising LHCD power in order to control
<strong>1.</strong> MAGNETIC CONFINEMENT<br />
23<br />
[<strong>1.</strong>19] A. A. Tuccillo et al.,<br />
Proc. 14 th Topical Conf. on<br />
Radio Frequency Power in<br />
Plasmas (Oxnard 2001),<br />
Vol. 595, p. 209<br />
[<strong>1.</strong>20] V. Pericoli-Ridolfini<br />
et al., Proc. 14 th Topical<br />
Conf. on Radio Frequency<br />
Power in Plasmas (Oxnard<br />
2001), Vol. 595, p. 245<br />
[<strong>1.</strong>21] V. Pericoli-Ridolfini<br />
et al., Study and<br />
optimisation of lower<br />
hybrid waves coupling<br />
in advanced scenario<br />
plasmas in JET, to be<br />
submitted to Plasma Phys<br />
Control. Fusion<br />
the q profile during the high phase of advanced-scenario plasmas.<br />
• Task Force S2 experiment aiming at steady-state ITBs.<br />
• Task Force M experiments on neoclassical tearing mode (NTM) stabilisation by<br />
LHCD and some experiments on the error field.<br />
The H and S2 activities were carried out in close collaboration with CEA and<br />
UKAEA.<br />
Task Force H<br />
<strong>1.</strong>1 Tokamak Physics<br />
The activity here consisted mainly in continuing LH coupling optimisation in<br />
relevant scenarios. After the success of the previous campaigns in 2000<br />
[<strong>1.</strong>19,<strong>1.</strong>20,<strong>1.</strong>21], efforts were concentrated on the utilisation of LH to actively control<br />
the q profile. As expected, LH proved to be very effective, both in the pre-heat phase,<br />
to optimise the target, and in the high power phase, to maintain the q profile, of<br />
advanced-tokamak plasmas. An example of the capability of LH to model the q<br />
profile is given in figure <strong>1.</strong>16. During plasma current ramp-up in the pre-heat phase<br />
of advanced scenario plasmas, the target q profile can be changed from weakly<br />
reversed to deeply reversed by adjusting the power level. This tool has made it<br />
possible to lower the power threshold of electron ITBs, and with the improvement in<br />
LH wave coupling, more than 3 MW can be routinely coupled in H-mode in ITB<br />
plasmas.<br />
Task Force S2<br />
[<strong>1.</strong>22] F. Crisanti, et al.,<br />
The new LHCD capability strongly accelerated the progress of Task Force S2. Quasi<br />
JET quasistationary<br />
steady-state ITBs time limited only by technical constraints were achieved, and full<br />
internal-transportbarrier<br />
operation with<br />
CD was obtained during the whole high-performance phase of <strong>1.</strong>8-MA ITB<br />
discharges [<strong>1.</strong>22]. Later on during C4, the <strong>ENEA</strong> collaboration was extended to<br />
active control of the<br />
experiments on feedback control of pressure and temperature profiles by using,<br />
pressure profile, accepted<br />
for publication on<br />
respectively, neutral beam and ion cyclotron waves [<strong>1.</strong>22]. Figure <strong>1.</strong>17 reports the<br />
time evolution of a few quantities characterising one of the longest ITB discharges<br />
Phys. Rev. Lett.<br />
(q 95 ≈6.0, β p ≈<strong>1.</strong>1, β N ≈<strong>1.</strong>7, β T ≈<strong>1.</strong>%, B T =3.4 T and I p =2 MA). In this discharge, an<br />
electron ITB is triggered at the beginning of LH coupling. The ion ITB forms<br />
immediately after neutron beam injection (NBI) and ICRH. Both barriers disappear<br />
when the additional power is switched off and are time limited only by JET<br />
hardware constraints. The loop voltage close to zero and the internal <strong>magnetic</strong><br />
inductance practically<br />
constant all over the highpower<br />
phase indicate a<br />
EFIT + MSE at 44.4S<br />
B T = 2.6 T<br />
5<br />
51164<br />
possible “freezing” of the<br />
51465<br />
CD profile due to LHCD.<br />
51466<br />
The electron barrier lasts<br />
P LH = 2.2 MW<br />
about 37 energy <strong>confinement</strong><br />
times and the ion<br />
Fig. <strong>1.</strong>16 - Control of q<br />
4<br />
51467<br />
profile with LHCD<br />
barrier about 27. The<br />
preheating in the<br />
duration of the ITB is,<br />
optimised shear scenario.<br />
however, comparable with<br />
Weakly to deeply 3<br />
the current resistive<br />
reversed q profile as a<br />
diffusion time.<br />
function of LHCD power.<br />
profile<br />
2<br />
2.0<br />
P LH = <strong>1.</strong>1 MW<br />
2.5<br />
3.0<br />
R maj (m)<br />
3.5 4.0<br />
In-depth analyses aimed at<br />
understanding turbulencereduction<br />
mechanisms were<br />
performed and reported at<br />
several conferences, e.g. the<br />
2001 EPS and APS. The
24<br />
<strong>1.</strong> MAGNETIC CONFINEMENT<br />
<strong>1.</strong>1 Tokamak Physics<br />
studies were focussed<br />
mainly on the role played<br />
by <strong>magnetic</strong> shear, under<br />
the hypothesis that<br />
turbulence is stabilised<br />
when the ExB shearing rate<br />
exceeds the linear growth<br />
rate of ITG modes.<br />
Task Force M<br />
0<br />
T io (keV)<br />
12<br />
Due to problems with the<br />
8<br />
plasma position feedback<br />
(pickup from the generated 4<br />
T eo (keV)<br />
mode), the experiments on 0<br />
Z eff (0)<br />
LHCD stabilisation of the 6<br />
NTM had just a couple of 4<br />
n<br />
useful shots. Only a slight<br />
eo (1019m-3)<br />
2<br />
H<br />
destabilising effect was<br />
89 β N<br />
observed in these 0.9<br />
discharges, suggesting 0.6<br />
li<br />
Vs<br />
interaction between LH 0.3<br />
waves and the mode, with 0<br />
inappropriate localisation<br />
2 4 6 8 10 12 14<br />
of the power. This is<br />
Time (s)<br />
encouraging in view of<br />
continuing the experiments in the 2002 campaigns.<br />
The aim of other Task Force M experiments was to study the behaviour and<br />
threshold scaling for error-field-induced locked modes at high beta poloidal. In past<br />
experiments on DIII-D, it was observed that the penetration threshold was lower at<br />
high beta. Although the observations made at JET are still inconclusive, a<br />
phenomenology has been observed that differs both from the classical penetration<br />
observations and from the onset of neoclassical tearing modes. Lack of power made<br />
it impossible to perform experiments far from the natural threshold for the onset of<br />
2/1 neoclassical tearing modes.<br />
Internal transport barrier analysis in JET<br />
3<br />
2<br />
1<br />
0<br />
12<br />
8<br />
4<br />
P LHCD (MW)<br />
P NBI (MW)<br />
I p (MA)<br />
R nt (1015n/s)<br />
P ICRH (MW)<br />
Analysis of the ITB in JET discharges was continued during the C4 experimental<br />
campaign (January-February 2001) and was focussed in particular on the effect of<br />
<strong>magnetic</strong> shear on ITB formation. The IDL code previously developed [<strong>1.</strong>23] to<br />
calculate the radial electric field (E r ) in the plasma, the E×B flow shearing rate (ω s )<br />
and the linear growth rate of ITG modes (γ ηi ) in ITB discharges was upgraded. In<br />
fact, γ ηi can be now calculated using an explicit dependence on the <strong>magnetic</strong> shear s<br />
(as given either by gyrokinetic and gyrofluid codes or by theoretical predictions). The<br />
results were applied to the analyses of ITB discharges from the C2 and C4<br />
campaigns. It was found that by taking into account the dependence of γηi on s, it is<br />
qualitatively possible to explain the radial location, the time of formation and the<br />
time evolution of different kinds of transport barriers in terms of the E×B shear flow<br />
suppression of ITG-driven electrostatic turbulence [<strong>1.</strong>24]. In addition, the carbon<br />
poloidal velocity (which is another output of the above IDL code), calculated<br />
according to the neoclassical theory, was compared with the results of the new JET<br />
spectroscopic diagnostic system (currently being commissioned), which provides a<br />
measurement of the impurity poloidal velocity. Reasonable agreement between the<br />
data was found [<strong>1.</strong>25].<br />
Fig. <strong>1.</strong>17 - Shot #5352<strong>1.</strong><br />
a) Plasma current - LHCD<br />
power; b) NBI and ICRH<br />
power - neutron yield; c)<br />
central ion and electron<br />
temperature; d) central<br />
electron density and<br />
effective Z-H 89 β N ; e)<br />
V loop and l i .<br />
[<strong>1.</strong>23] F. Crisanti et al.,<br />
Nucl. Fusion 41, 883<br />
(2001)<br />
[<strong>1.</strong>24] B. Esposito et al.,<br />
Proc. 28 th EPS Conf. on<br />
Contr. Fusion and Plasma<br />
Phys. (Madeira 2001), Vol.<br />
25A, p. 553<br />
[<strong>1.</strong>25] F. Sattin et al.,<br />
Proc. 28 th EPS Conf. on<br />
Control. Fusion and Plasma<br />
Phys. (Madeira 2001), Vol.<br />
25A, p. 373
<strong>1.</strong> MAGNETIC CONFINEMENT<br />
25<br />
[<strong>1.</strong>26] M.J. Mantsinen et<br />
al., ICRF heating<br />
scenarios in JET with<br />
emphasis on 4 He plasmas<br />
for the non-activated<br />
phase of ITER, presented<br />
at the 14 th Topical Conf.<br />
on Radio Frequency Power<br />
in Plasmas (Oxnard 2001),<br />
Vol. 595<br />
[<strong>1.</strong>27] V. G. Kiptily et al.,<br />
Gamma-rays: measurements<br />
and analysis at<br />
JET, presented at the<br />
6 th Inter. Conf. on<br />
Advanced Diagnostics for<br />
Magnetic and Inertial<br />
Fusion (Varenna 2001)<br />
[<strong>1.</strong>28] V. G. Kiptily et al.,<br />
Gamma-rays diagnostics<br />
of energetic ions in<br />
JET, presented at the<br />
7 th IAEA Technical<br />
Committee Meeting on<br />
Energetic Particles in<br />
Magnetic Confinement<br />
(Goteborg 2001) to be<br />
published on Nuclear<br />
Fusion<br />
[<strong>1.</strong>29] J. Mailloux,et al.,<br />
Progress in internal<br />
transport barrier plasmas<br />
with lower hybrid current<br />
drive and heating in JET<br />
accepted for publication<br />
0<br />
-1<br />
I p (MA)<br />
-2<br />
n e (1020<br />
1<br />
m-2)<br />
0.5<br />
0<br />
T<br />
2 i (10 keV)<br />
<strong>1.</strong>5<br />
1<br />
T e (eV)<br />
8<br />
6<br />
4<br />
Power (10 kW)<br />
<strong>1.</strong>5<br />
LH<br />
1 #53429<br />
0.5<br />
40<br />
45<br />
Time (s)<br />
Gamma diagnostics on JET<br />
<strong>1.</strong>1 Tokamak Physics<br />
Studies of fast-ion production during heating and the subsequent fast-ion behaviour<br />
in <strong>magnetic</strong>ally confined plasma, and evaluations of the resulting bulk ion heating<br />
efficiency are essentially important to fusion reactor development.<br />
Gamma-ray emission from nuclear reactions between fast ions and the main plasma<br />
impurities was observed during ICRH and NBI heating in the JET tokamak. Gammaray<br />
energy spectra provided information on the energy distribution function of the<br />
fast ions. The gamma-ray emission profiles obtained with the JET neutron profile<br />
monitor supplied information on the spatial distribution of reaction sites.<br />
In recent JET studies of the ITER-like ICRH scenarios ( 3 He)D and ( 3 He) 4 He,<br />
gamma-ray measurements gave invaluable information on the fast-ion population:<br />
a) first evidence for ICRF-induced pinch of 3 He-minority ions based on profile data;<br />
b) variation in the fast 3 He tail temperature that depends on 3 He concentration and<br />
c) experimental simulation of 3.5-MeV fusion-born alpha particles by diagnosing fast<br />
4 He ions accelerated to the MeV range [<strong>1.</strong>26,<strong>1.</strong>27,<strong>1.</strong>28].<br />
Effect of low <strong>magnetic</strong> shear induced by LHCD on high-performance ITBs in<br />
JET<br />
In JET a low/negative <strong>magnetic</strong> shear profile is maintained in a plasma target with<br />
2.4-MA plasma current by using 2.2 MW of lower hybrid power combined with NBI<br />
and ICRH. In this scenario, an ITB up to about 4 s is produced. The fraction of LH<br />
driven current is about 25% of the total plasma current. During LH power<br />
application, the layer with reversed shear q-profile can be maintained in a suitable<br />
radial position to inhibit the onset of turbulence, which might otherwise force the ITB<br />
to collapse. Lower hybrid power could be used to drive moderate amounts of noninductive<br />
off-axis current and sustain high-performance ITBs at high plasma current.<br />
The main plasma parameters and additional heating power time traces of two<br />
discharges of JET [<strong>1.</strong>29] are compared in figure <strong>1.</strong>18. In shot #53432, an increase in the<br />
central ion and electron temperatures is observed in the time range from 45.4 s to<br />
46.8 s. In shot #53429 the central temperatures show a prompt increase at the switchon<br />
of LH power, during the main heating phase. The increase is maintained for<br />
longer (3.2 s, from 45.8 s to 49.6 s). In both shots, the temperature rise is accompanied<br />
by a peaking of the temperature profiles, which suggests<br />
the formation of an ITB. The ITB collapse is accompanied<br />
a) by increased plasma-edge interaction, which produces<br />
an increase in Dα emission and the loss of LH antenna<br />
power coupling. On the other hand, in shot #53432 the<br />
b) ITB duration appears to be only <strong>1.</strong>2 s (from t=45.3 s to<br />
NBI<br />
#53429<br />
ICRH e)<br />
#53429<br />
c)<br />
d)<br />
Fig. <strong>1.</strong>18 - Time traces of the main plasma parameters<br />
of JET discharge #53429 compared with a similar<br />
shot (#53432) without LHCD coupling in the main<br />
heating phase. Plasma current: a) # 53429 red curve,<br />
#53432 pink. Line integrated plasma density: b)<br />
#53429 red curve, #53432 black. Central ion<br />
temperature: frame c) #53429 dashed/red, #53432<br />
continuous line/pink. Central electron temperature:<br />
d) #53429 squares/red, #53432 rhombus/pink e)<br />
NBI power, #53429 red, #53432 blue; ICRH power,<br />
#53429 pink, #53432 yellow; LHCD power, #53429<br />
green, #53432 black.
26<br />
<strong>1.</strong> MAGNETIC CONFINEMENT<br />
<strong>1.</strong>1 Tokamak Physics<br />
t=46.5 s). No change in<br />
plasma-edge activity is<br />
observed in concomitance<br />
with the ITB collapse.<br />
1<br />
The effect of LHCD on <strong>magnetic</strong><br />
shear might have helped to<br />
sustain the ITB in shot #53429, as<br />
0<br />
suggested by the modelling<br />
analysis performed by the<br />
JETTO code [<strong>1.</strong>30] and LH ray 2-<br />
D Fokker Planck ray tracing. As -1<br />
a result [<strong>1.</strong>31], the power is fully<br />
deposited off-axis within the<br />
layer ρ≈0.4-0.7, with a maximum<br />
at ρ≈0.5 (ρ is the square root of<br />
the normalised toroidal flux).<br />
The ITB is located in this layer.<br />
The calculated fraction of LH<br />
0.3 0.4 0.5<br />
ρ<br />
0.6 0.7 0.8<br />
driven current is<br />
I LHCD /I P ≈0.25, while the<br />
noninductive current fraction is<br />
(I LHCD +I boot +I NBI )/I P ≈0.65. 0.5<br />
The q-profile of discharge<br />
t = 47s<br />
#53429 simulated by the<br />
t = 46s<br />
JETTO code shows a reversed 0<br />
shape during the main<br />
heating phase. Figure <strong>1.</strong>19<br />
reports the simulated -0.5<br />
<strong>magnetic</strong> shear profiles at<br />
0.3<br />
0.4<br />
different times during the<br />
ρ<br />
main heating phase. After the<br />
LH power is switched on, the<br />
0.5<br />
0.6<br />
s=0 layer of the <strong>magnetic</strong> shear profile moves outward and persists in the region<br />
ρ>0.3. As anomalous transport is dominant in this region, the low/negative<br />
<strong>magnetic</strong> shear could inhibit the growth of turbulent modes that cause the ITB<br />
collapse. No change in the q profile is expected at the time of the ITB collapse in the<br />
experiment. However, the collapse might be related to edge physics, as it<br />
accompanies an increase in Dα emission.<br />
Magnetic shear s<br />
Magnetic shear s<br />
For shot #53429, with LH power coupled during the main heating phase, modelling<br />
suggests that the collapse can be produced by an inward movement of the s=0 layer<br />
[(ρ
<strong>1.</strong> MAGNETIC CONFINEMENT<br />
27<br />
<strong>1.</strong>2.1 FTU machine<br />
<strong>1.</strong>2 FTU Facilities<br />
Summary of machine operation<br />
The FTU machine operated throughout 2001, with only the one summer shutdown.<br />
No major problems arose during the experimental campaigns, except for a vacuum<br />
leak during startup in February and, consequently, the loss of two experimental<br />
weeks. In fact, during the experimental phase, with full available power, strong<br />
influxes on the manganese caused systematic plasma disruptions. This behaviour<br />
originated from the heat load on the stainless steel structure of the MHD rings that<br />
acted as a limiter inside the vacuum vessel, so the rings were removed during the<br />
summer shutdown.<br />
With the new boronisation system, the scientific objectives of reducing Z eff and<br />
radiative losses, especially at low density, were reached. The first boronisation of the<br />
vacuum vessel in October 2001 was performed with the machine at room<br />
temperature. Afterwards, it was done with the machine cooled down to liquid<br />
nitrogen temperature and baking the vessel so that only one experimental day was<br />
lost instead of a week.<br />
The remote handling tools for vacuum-vessel inspections are continuously updated.<br />
It is now possible to visually examine the vessel through only one port. The new<br />
remote arm covers half the torus in one direction and the other half in the opposite<br />
direction. The images are digitalised and stored in a computer connected to Internet<br />
and available to all users.<br />
The scientific exploitation of FTU data is strictly related to data-access tools, so<br />
particular attention was devoted to this aspect. In addition to the AFS and the<br />
MDSplus servers, a new data layer that is compatible with the standard CORBA was<br />
developed to allow users to access data from their own PC by running a local Matlab<br />
or IDL code. This effort can also be considered as part of the general issue of remote<br />
participation, which has been greatly emphasised since the establishment of the<br />
multilateral European Fusion Development Agreement (EFDA) on which the<br />
European fusion research program is based. Again in this framework, the assessment<br />
of video conferencing tools, namely the Virtual Rooms Videoconferencing System<br />
(VRVS), was completed. Two permanent conference rooms and one movable station,<br />
equipped with PCs, were set up for Local Presentation, VRVS mbone, VNC sharing<br />
presentation transmission, unidirectional WebCast and Yahoo chatting. A number of<br />
personal VRVS-desktop set-ups are also available, but have not yet been used.<br />
Remote meetings were organised between <strong>ENEA</strong> Frascati, CNR Milano, CNR<br />
Padova and EFDA JET.<br />
Fig. <strong>1.</strong>21 - Sources of<br />
downtime.<br />
During 2001, 1909 shots were completed successfully out of a total of 2117 performed<br />
in 91 experimental days. The average number of successful daily pulses was 20.95.<br />
Table <strong>1.</strong>II gives the main parameters for evaluating the efficiency of the experimental<br />
sessions. Figure <strong>1.</strong>21 reports the source of downtime in 200<strong>1.</strong> It is worth noting that<br />
the time required to analyse the discharges is still the main source of downtime.<br />
During the experimental<br />
Analysis<br />
27%<br />
Diagnostic<br />
Systems<br />
8%<br />
Others<br />
9%<br />
Machine<br />
9%<br />
Control System<br />
17%<br />
Power Supplies<br />
15%<br />
Radiofrequency<br />
15%<br />
campaigns the tokamak<br />
power supplies and the<br />
control and data acquisition<br />
system operated at a very<br />
high level of availability and<br />
reliability. The percentage of<br />
time lost because of controlsystem<br />
problems was reduced<br />
to 17%.
28<br />
<strong>1.</strong> MAGNETIC CONFINEMENT<br />
<strong>1.</strong>2 FTU Facilities<br />
Table <strong>1.</strong>II Machine efficiency in 2001<br />
January February March April May June July September October November December<br />
Total pulses 111 180 238 352 406 92 130 141 265 202<br />
Successful pulses (sp) 103 159 214 312 375 80 116 138 239 173<br />
I(sp) 0.93 0.88 0.90 0.89 0.92 0.87 0.89 0.98 0.90 0.86<br />
Total<br />
2117<br />
1909<br />
0.90<br />
Potential experimental days 10 9.5 11 18 17 4 5 7 12.1 10<br />
Real experimental days 5 8 10 14 17 4 5 7 12.1 9<br />
I(ed) 0.50 0.84 0.91 0.78 <strong>1.</strong>00 <strong>1.</strong>00 <strong>1.</strong>00 <strong>1.</strong>00 <strong>1.</strong>00 0.90<br />
104<br />
91<br />
0.88<br />
Experimental minutes 1819 2879 3971 6023 7640 1803 2165 2561 4845 3867<br />
Delay minutes 1323 1925 2402 2403 2801 621 640 1622 2672 1958<br />
I(et) 0.58 0.60 0.62 0.71 0.73 0.74 0.77 0.61 0.64 0.66<br />
A(sp/d) 20.60 19.88 2<strong>1.</strong>40 22.29 22.06 20.00 23.20 19.71 19.75 19.22<br />
A(p/d) 22.20 22.50 23.80 25.14 23.88 23.00 26.00 20.14 2<strong>1.</strong>90 22.44<br />
37573<br />
18367<br />
0.67<br />
20.95<br />
23.24<br />
DELAY FOR SYSTEM (minutes)<br />
January February March April May June July September October November December Total %<br />
MACHINE 0 43 466 52 159 193 29 19 140 228 274 1603 8.7<br />
POWER SUPPLIES 0 192 528 894 310 239 22 31 287 10 279 2792 15.2<br />
RADIO FREQUENCY 0 81 59 280 697 738 188 112 247 221 53 2676 14.6<br />
CONTROL SYSTEM (PROMETEO) 0 347 235 319 232 402 223 24 19 344 287 2432 13.2<br />
DAS 0 0 0 172 44 92 7 4 52 63 54 488 2.7<br />
FEEDBACK 0 20 0 0 22 0 0 17 27 24 10 120 0.7<br />
NETWORK 0 143 208 92 0 0 0 0 0 461 84 988 5.4<br />
DIAGNOSTIC SYSTEMS 0 213 219 85 179 276 17 166 89 133 150 1527 8.3<br />
ANALYSIS 0 279 209 350 634 785 135 265 735 1009 734 5135 27.9<br />
OTHERS 0 5 17 158 126 76 0 2 26 179 33 622 3.4<br />
TOTALE 0 1323 1941 2402 2403 2801 621 640 1622 2672 1958 18383 100<br />
Summary of machine maintenance<br />
Maintenance of the FTU system was carried out according to schedule. Visual<br />
inspection of the vacuum vessel revealed ten displaced tiles, most of which in the<br />
upper and bottom rows. The rupture was investigated through specific laboratory<br />
tests and it was found that the fragility of tungsten-zirconium-molybdenum (TZM)<br />
can damage the supporting-screw thread. A new design tile-support structure was<br />
developed and will be tested in 2002.<br />
The new data storage system based on SAN architecture was released, and the whole<br />
FTU experimental data archive is on line. A preliminary test of Opto22 technology in<br />
slow acquisition, i.e., replacing the traditional PLC, was carried out.<br />
Future activities<br />
In 2002 the machine will operate up to July and then from mid-September to mid-<br />
October if the injector for launching pellets from the high-field side is ready. New<br />
diagnostics and the new passive-active multijunction (PAM) lower hybrid launcher<br />
will be installed during the second shutdown in 2002. All four ECRH gyrotrons will<br />
be in operation, so a total power of <strong>1.</strong>6 MW should be available. A new density<br />
feedback system based on VME architecture will be implemented.<br />
Boronisation system<br />
Direct current glow discharge deposition is used to coat the vacuum vessel walls<br />
with a boron film. The deposition system is the same as that used for the vacuum<br />
chamber conditioning, but the vessel is fuelled with a mixture of helium and<br />
diborane (90% He and 10% B 2 H 6 ). The aim of boronisation is to reduce the effective<br />
charge Z eff and the plasma radiation losses by introducing a low-Z element as firstwall<br />
material.
<strong>1.</strong> MAGNETIC CONFINEMENT<br />
29<br />
<strong>1.</strong>2 FTU Facilities<br />
Fig. <strong>1.</strong>22 - Schematic of<br />
the boronisation plant.<br />
FTU<br />
VG1-1<br />
IE<br />
AD<br />
AD<br />
IE<br />
VG1-2<br />
F2<br />
F2<br />
F2<br />
F2<br />
VG1-3<br />
AD<br />
IE<br />
AD<br />
IE<br />
VG1-4<br />
FTU<br />
FTU HALL<br />
VG1-M<br />
GAS PIPELINE<br />
ABOUT 30 m<br />
CABINET<br />
IE1<br />
FC<br />
Al camino<br />
NEUTRAL GAS MODULE<br />
V0<br />
V1<br />
Bottle He<br />
D1<br />
Al camino<br />
S1<br />
CR1<br />
VG1-1 = valve<br />
VG1-2 = valve<br />
VG1-3 = valve<br />
VG1-4 = valve<br />
VG1-M = valve<br />
S2<br />
GAS ACTIVE MODULE<br />
CR2 V3<br />
Vacuum<br />
Pump<br />
V2<br />
MHP<br />
V5<br />
V4<br />
F1<br />
VB<br />
V6<br />
MBP<br />
D2<br />
MMP<br />
Bottle<br />
He (90%)+B 2 H 6 (10%)<br />
F2 = filter a 0.2 µm<br />
IE = electric break<br />
IE1= electric break<br />
FC = flux controller<br />
[<strong>1.</strong>32] W.R. Baker et al.,<br />
Vuoto, XXVIII, N. 3-4,<br />
(1999)<br />
[<strong>1.</strong>33] W. Braker and A.L.<br />
Mossman, Matheson gas<br />
data handbook, (Ed.<br />
Matheson, 1980) pp. 219-<br />
223<br />
[<strong>1.</strong>34] W. Stopford and<br />
W.B. Bunn, Effects of<br />
exposure to toxic gases,<br />
(Ed. Matheson, 1988) pp.<br />
21-27<br />
The FTU boronisation system was designed and installed by the Italian company<br />
RIVOIRA on the basis of the previous experience at RFX [<strong>1.</strong>32]. Diborane is both<br />
toxic and explosive and hence requires particular safety measures [<strong>1.</strong>33,<strong>1.</strong>34]. To<br />
facilitate operation and improve safety, the whole system is equipped with its own<br />
remote control and protection system.<br />
The diborane system consists of the following main elements (fig. <strong>1.</strong>22):<br />
• A special gas cabinet for toxic gas mixtures, with its own exhaust system<br />
comprising a gas extractor and a chemical filter to decompose diborane in the case of<br />
accidental release.<br />
• A chemical filter placed at the inlet of the rotary pump to evacuate the gas<br />
immission lines from diborane at the end of boronisation.<br />
• Pneumatic valves inside the gas cabinet, which are all operated with compressed<br />
nitrogen to avoid the risk of sparks or fires.<br />
• A diborane bottle with a remotely controlled pneumatic valve.<br />
• A gas flux controller to regulate the gas-feed rate.
30<br />
<strong>1.</strong> MAGNETIC CONFINEMENT<br />
<strong>1.</strong>2 FTU Facilities<br />
• Gas lines with special connections to guarantee both high- and low-pressure<br />
tightness.<br />
• Four vertical ports to introduce the gas, which are located 90° toroidally apart<br />
from each other;<br />
• Two evacuation lines of the main vacuum system of FTU, placed at the two<br />
opposite sides of the torus. Each line has a standard 2000 l/s turbomolecular pump,<br />
a thermal decomposer for diborane (operation temperature 500°C) and a special<br />
rotary pump modified to assure very good vacuum tightness and to dilute the<br />
exhaust gas with nitrogen before it comes into contact with the air;<br />
• Diborane detectors (sensitivity 1ppb).<br />
Some interlocks were installed to ensure safe operation. They cause automatic<br />
closure of the diborane pneumatic bottle valve and the gas flux should a fault occur.<br />
The walls are maintained at 373 K during film deposition and subsequently cooled<br />
to 77 K. Two electrodes, 180° toroidally apart, are inserted from two vertical ports up<br />
to the centre of the vacuum chamber. The glow discharge conditions are 7×10 -3 mbar<br />
total pressure with <strong>1.</strong>7 mbar l s -1 of average flow rate, a voltage drop of +360V and<br />
a 0.75-A driven current for each electrode, corresponding to 11 mA/cm 2 of total<br />
current density on the vessel walls. According to the laboratory tests on silicon films,<br />
three hours are necessary to reach the target film-thickness of 100 nm [<strong>1.</strong>35].<br />
First-wall TZM tile refurbishment<br />
[<strong>1.</strong>35] M.L. Apicella et al.,<br />
J. Nucl. Mater. 212-215,<br />
1541 (1994)<br />
During the FTU experimental campaigns, some first-wall TZM tiles were damaged.<br />
The main problem occurred at the location of the tile attachment where brittle<br />
behaviour was observed. To improve the attachment strength, a new type of tile was<br />
designed (fig. <strong>1.</strong>23) according to tensile test results and to a detailed stress analysis<br />
simulating the force history of the threaded region. A new set of tiles was ordered<br />
and will be supplied in 2002.<br />
Electro<strong>magnetic</strong> loads on toroidal limiter tiles<br />
Following the failure of the TZM tiles, the loads on the toroidal limiter, due to eddy<br />
currents during fast disruptions, were investigated by detailed electro<strong>magnetic</strong> (EM)<br />
analysis of the components. The analysis input was derived from the most<br />
dangerous event observed in the FTU machine, and the numerical simulation was<br />
done with the time evolving MHD equilibrium code MAXFEA. Figure <strong>1.</strong>24 reports<br />
the time behaviour of the main<br />
macroscopic plasma parameters, the<br />
finite-element model (FEM) and the<br />
main results. The conclusion is that<br />
although the EM loads on the limiter<br />
tiles could determine breakage of<br />
tiles already damaged, the loads are<br />
not the main reason for the tile<br />
failure.<br />
VOM MISES (MPa)<br />
<strong>1.</strong>2.2 Heating systems<br />
LHCD system<br />
In 2001 the last two gyrotrons,<br />
delivered by Thomson and tested on<br />
dummy loads at full power, were put<br />
in operation, so the LHCD system is<br />
> 5.00e + 02<br />
< 5.00e + 02<br />
< 4.17e + 02<br />
< 3.34e + 02<br />
< 2.50e + 02<br />
< <strong>1.</strong>67e + 02<br />
< 8.39e + 01<br />
< 6.91e + 01<br />
max = 9.80e + 02<br />
min = 6.91e - 01<br />
Fig. <strong>1.</strong>23 - FEM simulation<br />
of first-wall TZM tile.
<strong>1.</strong> MAGNETIC CONFINEMENT<br />
31<br />
<strong>1.</strong>2 FTU Facilities<br />
<strong>1.</strong>8<br />
<strong>1.</strong>4<br />
<strong>1.</strong>1<br />
0.7<br />
a)<br />
now complete (six gyrotrons and two coupling<br />
structures). In this configuration, the system has<br />
routinely operated with a total rf power of about 2.2<br />
MW coupled to the plasma. The maximum electron<br />
temperature achieved is about 12 keV. The system has<br />
operated in synergy with the ECRH system, reaching,<br />
in this case, an electron temperature of about 15 keV.<br />
0.4<br />
The new launchers<br />
0.0<br />
0.0<br />
<strong>1.</strong>6<br />
3.2<br />
Fig.<strong>1.</strong>24 a<br />
4.8<br />
1 . 10-3<br />
6.4 8.0<br />
b)<br />
At the end of 2001, the conventional multijunction<br />
(MJ) grill was delivered to <strong>ENEA</strong>. The MJ with passive<br />
waveguides (PAM) and the ancillary components<br />
(dummy loads, short circuits, couplers, etc.) needed<br />
for the complete rf test of both the launchers were still<br />
under construction.<br />
ECRH system<br />
In 2001 the ECRH system operated with two gyrotrons<br />
providing a total power of 800 kW at the plasma, at<br />
nominal pulse length. To improve the power supply<br />
system, a new voltage reference generator was<br />
developed and successfully installed. The new system<br />
is based on National Instruments hardware, has faster<br />
control and a greater rejection of EM noise.<br />
<strong>1.</strong>2.3 Diagnostics<br />
Moments (Nm)<br />
Moments (Nm)<br />
Moments (Nm)<br />
100<br />
0<br />
-100<br />
40<br />
0<br />
-40<br />
-100<br />
-140<br />
0.001<br />
0.002<br />
0.003<br />
0.004<br />
0.005<br />
+ x x x x + + + + + + + + + +<br />
x<br />
+ + +<br />
0.001 x 0.002 0.003<br />
0.004<br />
x x<br />
x<br />
x 0.005<br />
x<br />
x x x<br />
x<br />
x<br />
x<br />
x<br />
x<br />
x<br />
Time (s)<br />
0.006<br />
Time (s)<br />
0.006<br />
40 x x<br />
Time (s)<br />
x<br />
x<br />
0 x x x + + + + + + + + + +<br />
0.001 x 0.002 0.003 0.004 x x 0.006<br />
x<br />
x 0.005<br />
-40<br />
x x x<br />
x<br />
x x<br />
-100<br />
x<br />
x<br />
x<br />
-140<br />
x<br />
x<br />
x<br />
x<br />
+<br />
x<br />
+<br />
x<br />
+<br />
Mx_1<br />
My_1<br />
Mz_1<br />
Mx_2<br />
My_2<br />
Mz_2<br />
Mx_3<br />
My_3<br />
Mz_3<br />
Mx_4<br />
My_4<br />
Mz_4<br />
Mx_5<br />
My_5<br />
Mz_5<br />
Mx_6<br />
My_6<br />
Mz_6<br />
Mx_7<br />
My_7<br />
Mz_7<br />
Mx_8<br />
My_8<br />
Mz_8<br />
Mx_9<br />
My_9<br />
Mz_9<br />
Fig. <strong>1.</strong>24 a) Current disruption at <strong>1.</strong>6 MA. b) FEM used<br />
for EM analysis of the toroidal limiter: tiles are<br />
blanked out to expose the model. c) Radial (x),<br />
vertical (y) and toroidal (z) torque components on<br />
each tile, relative to tile centres, plotted vs. time for<br />
the disruption event described in a).<br />
c)<br />
Development of active beam diagnostics<br />
Measurements of the motional Stark effect (MSE) and<br />
of charge-exchange spectroscopy will yield data on the<br />
radial profiles of q, ion temperature and poloidal<br />
velocity. Both measurements will use a fast-hydrogenatom<br />
(40 keV) injector, which is being tested at the<br />
Frascati laboratory.<br />
The characteristics of the neutral beam injector, which<br />
was previously used in the Canadian TdeV<br />
laboratory, were measured in a reduced configuration,<br />
i.e., by using a single-hole extraction grid rather than<br />
the full 19-hole grid. A new bolometer, consisting of a<br />
set of 12 Cu plates whose temperature was measured<br />
by embedded thermocouples, was used to measure<br />
the output power.<br />
The beam parameters (gas feed, decelerating and<br />
accelerating grid voltages and compressor coil<br />
current) were optimised by maximising the output<br />
power and emitted light. The optimum conditions in<br />
this situation could not be reached because it was<br />
impossible to operate both the source and the<br />
neutraliser at the desired pressures. A directly heated<br />
W filament that is simpler and easier to use has<br />
substituted the original LaB6 cathode, which had to be<br />
replaced frequently and had irregular behaviour. A
32<br />
<strong>1.</strong> MAGNETIC CONFINEMENT<br />
<strong>1.</strong>2 FTU Facilities<br />
new control system using modules addressable via the Net was set up and tested. In<br />
the next phase, the beam will be tested at full power before installation on FTU.<br />
The MSE optics has been designed with the observed chord divided in two sections<br />
to reduce the aperture of each section. The relay optics will include two mirrors on<br />
each section and a system of lenses to image the plasma outside the port. All of the<br />
glass components will be made out of a low Verdet-coefficient material. The first<br />
periscope components will be placed close to the plasma, inside a temperaturecontrolled<br />
tube to avoid the window freezing in the cold FTU environment. The<br />
photoelastic modulator polarimeter was pre-assembled, and lock-in detection was<br />
compared with a Fourier analysis deconvolution for the interesting signal frequency<br />
acquired on fast analog-digital converters (ADCs). The Fourier analysis was<br />
preferred as it is less sensitive to hardware noise.<br />
Charge-exchange spectroscopy will operate on 12 vertical lines and f/2 collection<br />
optics. A high-aperture high-resolution image spectrometer with an echelle grating<br />
has been set up and is being equipped with a high-gain image intensifier.<br />
Oblique ECE measurements<br />
It is generally assumed that the bulk electron distribution function is well described<br />
by a Maxwellian distribution function. While qualitative theoretical arguments<br />
support this assumption, determination of the exact form of the bulk distribution<br />
function, in the presence of additional heating and transport processes, is beyond<br />
today’s computational capabilities. From the experimental point of view, the<br />
hypothesis of a Maxwellian distribution is at the basis of the interpretation of<br />
temperature measurements. In the case of Thomson scattering, this is so even if the<br />
scattered spectrum, in principle, contains information about the form of the<br />
(typically perpendicular) 1-D distribution function, which could be used to ascertain<br />
the above hypothesis. In the case of electron cyclotron emission (ECE), the<br />
temperature measurements give the perpendicular slope of the distribution function<br />
averaged over a small region of phase space (for optically thick plasmas), whose<br />
extension is determined by the temperature and density profiles and the specific<br />
instrumental parameters of the diagnostic. Multiharmonic ECE spectra, measured by<br />
Michelson interferometry perpendicularly to the <strong>magnetic</strong> field, can provide a coarse<br />
scan at different perpendicular energies, for low parallel energy.<br />
Oblique ECE spectra can provide a continuous scan of the distribution in parallel<br />
energy by changing the observation angle, for roughly constant perpendicular<br />
energy. These two types of ECE measurements are complementary, and only their<br />
combination can give a 2-D scan of the electron distribution function in velocity<br />
space [<strong>1.</strong>36].<br />
Recently, both theoretical [<strong>1.</strong>37] and experimental [<strong>1.</strong>38] evidence has emerged that<br />
points to the existence of a distortion of the bulk electron distribution function<br />
during on-axis ECH on FTU. The analysis of this phenomenon motivates the present<br />
study, in which the first measurements on FTU with oblique ECE are reported.<br />
An oblique view of FTU plasmas is achieved through one of the transmission lines<br />
of the ECH system [<strong>1.</strong>39]. The line, consisting partly of closed metallic oversized<br />
waveguides and partly of quasi-optical sections, was opened and collimating optics<br />
was installed to focus the radiation emitted by the plasma and transported through<br />
the ECH waveguide up to the receiving antenna. The emitted radiation is analysed<br />
by a 32-channel heterodyne radiometer (2 nd harmonic, X-mode). The radiometer,<br />
originally designed for perpendicular measurements (φ=0˚) during ECH with high<br />
spectral resolution (∆f~1 GHz), was moved temporarily to the ECH line for the<br />
oblique measurements. The ECH launcher, which is used to collect the radiation<br />
[<strong>1.</strong>36] V. Krivenski and V.<br />
Tribaldos, Proc. 20 th EPS<br />
Conf. on Contr. Fusion and<br />
Plasma Physics (Lisboa<br />
1993) Vol. 17C, 1045<br />
[<strong>1.</strong>37] V. Krivenski, Proc.<br />
11 th Joint Workshop on<br />
ECE and ECRH, Fusion<br />
Eng. &. Des. 53, 23 (2001)<br />
[<strong>1.</strong>38] O. Tudisco et al.,<br />
Proc. 26 th EPS Conf. on<br />
Contr. Fusion and Plasma<br />
Physics (Maastrict 1999)<br />
Vol. 23J, p. 101<br />
[<strong>1.</strong>39] C. Sozzi et al., Proc.<br />
13 th Topical Conf.<br />
Applications of RF power<br />
to Plasmas (AIP Press,<br />
1999) p. 462
<strong>1.</strong> MAGNETIC CONFINEMENT<br />
33<br />
<strong>1.</strong>2 FTU Facilities<br />
emitted by the plasma, can be steered at different toroidal angles (φ=0˚, ±10˚, ±20˚,<br />
±30˚, with respect to the normal direction) and can also perform a continuous<br />
poloidal scan. Due to the narrow frequency range of the radiometer (247-287 GHz),<br />
observation of the plasma centre during on-axis ECH is possible only for φ=0° and<br />
±10°.<br />
In order to minimise the amount of O-mode radiation reaching the radiometer for<br />
oblique viewing, a polariser was installed in front of the antenna. The polariser is a<br />
quarter-wave plate, whose optical axis can be rotated to compensate for the change<br />
in polarisation of the X-mode when the observation angle is changed. For these<br />
preliminary measurements, the polariser is not a perfect quarter wave device and<br />
therefore conversion of the X-mode elliptical polarisation into linear is not complete.<br />
It was estimated that, for measurements at φ=±10°, the polariser reduces the<br />
contribution of the O-mode emission from 15% to 4%.<br />
[<strong>1.</strong>40] P. Buratti and M.<br />
Zerbini, Rev. Sci. Instrum.<br />
66, 4208 (1995)<br />
[<strong>1.</strong>41] O. Tudisco et al.,<br />
Rev. Sci. Instrum. 67,<br />
3108 (1996)<br />
[<strong>1.</strong>42] P. Buratti et al.,<br />
Phys. Rev. Lett. 82, 560<br />
(1999)<br />
Two other ECE systems are routinely used on FTU: an absolutely calibrated<br />
Michelson interferometer that measures the ECE spectrum over five harmonics with<br />
moderate temporal resolution (5 ms) [<strong>1.</strong>40] and a 12-channel grating polychromator<br />
with a 10-ms time resolution [<strong>1.</strong>41]. Both spectrometers measure the emission with<br />
the line of sight in the mid-plane, normal to the <strong>magnetic</strong> field.<br />
The radiometer has better spatial resolution (∆r≈±1 cm, ∆z≈±<strong>1.</strong>8 cm) than the<br />
interferometer (∆r≈±2.5 cm, ∆z≈±2 cm) and polychromator. This difference is<br />
appreciable in the presence of peaked temperature profiles, like those discussed here.<br />
Oblique ECE measurements were performed on the current ramp phase, with central<br />
ECH and at low or reversed <strong>magnetic</strong> shear and moderate density [<strong>1.</strong>42]. The time<br />
evolution of the radiation temperature profile for this type of discharge, as measured<br />
by the Michelson interferometer, is shown in figure <strong>1.</strong>25. Although only one gyrotron<br />
(360 kW) was available in this experiment, very peaked radiation temperature<br />
profiles were obtained, with maximum values of the central temperature up to<br />
11 keV.<br />
Analysis of the Michelson spectra measured in these conditions shows that, at the<br />
3 rd , 4 th and downshifted 2 nd harmonics, the level of emission (corresponding to a<br />
scan of the distribution function in perpendicular energy if the energy of the<br />
electrons responsible for emission at these harmonics is taken into account) is much<br />
lower than expected from the high value of the central temperature. This anomaly<br />
occurs because the bulk distribution function is distorted due to strong localisation<br />
of ECH energy, which provokes an increase in the 2 nd harmonic emission. This<br />
effect is in good quantitative agreement with simulations [<strong>1.</strong>37].<br />
Fig. <strong>1.</strong>25 - Time evolution<br />
of the radiation temperature<br />
profile as<br />
measured by the<br />
Michelson interferometer.<br />
The ECH pulse is<br />
applied at t=0.10 s.<br />
Tradiation (keV)<br />
12<br />
# 19462<br />
0.134 s<br />
10<br />
0.129 s<br />
8<br />
6<br />
4<br />
2<br />
0.119 s<br />
0.109 s<br />
0.104 s<br />
0.1 s<br />
0<br />
0.8 0.9 1 <strong>1.</strong>1 <strong>1.</strong>2<br />
R(m)<br />
A scan of the distribution function in<br />
parallel energy by ECE measurements at<br />
different observation angles should also<br />
reveal the existence of a non-Maxwellian<br />
bulk [<strong>1.</strong>37], which is the goal of the<br />
present experiment.<br />
Figure <strong>1.</strong>26 shows the computed angular<br />
dependence of the emission spectra for<br />
conditions similar to the experimental<br />
ones and compares the effects of<br />
Maxwellian and non-Maxwellian bulks.<br />
If the perpendicular emission spectrum<br />
is selected in the frequency range near<br />
the 2 nd harmonic and the corresponding
34<br />
<strong>1.</strong> MAGNETIC CONFINEMENT<br />
<strong>1.</strong>2 FTU Facilities<br />
temperature profile is obtained by<br />
assuming a Maxwellian distribution,<br />
and then this temperature profile is<br />
used to compute the expected<br />
emission spectra for different<br />
observation angles, these spectra<br />
overestimate the actual radiation<br />
temperature, if the distribution<br />
function is not Maxwellian.<br />
The temperature profiles measured<br />
during an ECH pulse by the Michelson<br />
interferometer (for φ=0°) and by the<br />
radiometer (for φ=10°) are compared in<br />
figure <strong>1.</strong>27. The radiometer was<br />
calibrated using the Michelson<br />
temperature in the Ohmic phase of the<br />
discharge, when the temperature<br />
profile is rather flat and the<br />
distribution function nearly<br />
Maxwellian. The peak of the<br />
temperature profile measured with the<br />
radiometer shows the characteristic<br />
frequency upshift due to the Doppler<br />
effect. The radiometer peak is also<br />
thinner than the Michelson peak, due<br />
to better instrumental resolution. For a<br />
more direct interpretation of the<br />
experiment, the perpendicular<br />
emission should also be measured<br />
with the radiometer. Unfortunately,<br />
these spectra are not available because<br />
stray radiation from the gyrotron<br />
cannot be effectively filtered for φ=0°.<br />
Therefore, the perpendicular spectra of<br />
the radiometer were simulated, first<br />
deriving the temperature profile over<br />
this frequency range from the<br />
Michelson spectra (assuming a<br />
Maxwellian distribution) and then<br />
computing the corresponding spectra<br />
of the radiometer for φ=0° and 10°.<br />
(This is the same procedure as that<br />
followed to obtain the results of figure<br />
<strong>1.</strong>26, but now using the experimental<br />
Michelson spectrum.) In the<br />
calculations, the nominal instrumental<br />
resolution of the two diagnostics was<br />
0<br />
240 260 280 300 320<br />
Frequency (GHz)<br />
used. Figure <strong>1.</strong>28 summarises the result. The perpendicular spectrum of the<br />
radiometer is both higher and thinner than the corresponding spectrum of the<br />
interferometer, due to the better instrumental resolution of the former. The computed<br />
oblique spectrum (assuming a Maxwellian distribution) is higher than the measured<br />
spectrum, in qualitative agreement with the discrepancy expected when the<br />
distribution function has a non-Maxwellian bulk (fig. <strong>1.</strong>25). Further experimental<br />
investigation is needed to confirm this conclusion and to test the quantitative<br />
agreement with the theory.<br />
Tradiation (keV)<br />
Tradiation (keV)<br />
Tradiation (keV)<br />
12<br />
10<br />
12<br />
10<br />
8<br />
6<br />
4<br />
2<br />
8<br />
6<br />
4<br />
2<br />
Maxw.<br />
FP<br />
Fig. <strong>1.</strong>26<br />
Michelson<br />
# 19462<br />
0° 10°<br />
20°<br />
Radiometer<br />
Radiom.<br />
0.134 s<br />
0.124 s<br />
0.1 s<br />
0<br />
220 240 260 280 300 320 340<br />
Frequency (GHz)<br />
14<br />
12<br />
10<br />
8<br />
6<br />
4<br />
2<br />
Maxw.<br />
Radiom.<br />
Maxw.<br />
Michelson<br />
0°<br />
10°<br />
Exp.<br />
Michelson<br />
0<br />
240 260 280 300 320<br />
Frequency (GHz)<br />
Exp.<br />
Radiom.<br />
Fig. <strong>1.</strong>26 - Angular<br />
dependence of emission<br />
spectra computed for a<br />
non-Maxwellian bulk (FP)<br />
and for the temperature<br />
profile which, assuming a<br />
Maxwellian distribution,<br />
gives an identical spectrum<br />
over this frequency<br />
range for φ=0°. (Instrumental<br />
parameters of the<br />
radiometer).<br />
Fig. <strong>1.</strong>27 - Measured ECE<br />
spectra from perpendicular<br />
(φ=0°, Michelson)<br />
and oblique ECE (φ=10°,<br />
radiometer) during<br />
central ECH.<br />
Fig. <strong>1.</strong>28 - Measured<br />
spectra at τ=0.134 s and<br />
simulated spectra for the<br />
radiometer instrumental<br />
parameters (φ=0°, 10°),<br />
computed with the temperature<br />
profile obtained<br />
over this frequency range<br />
from the interferometer<br />
and assuming a Maxwellian<br />
distribution. Compare<br />
with the angular dependence<br />
in fig. <strong>1.</strong>26.
<strong>1.</strong> MAGNETIC CONFINEMENT<br />
35<br />
[<strong>1.</strong>43] M. Talvard, G.<br />
Giruzzi and W. D. Liu,<br />
Proc. 19th EPS Conf. on<br />
Contr. Fusion and Plasma<br />
Physics (Innsbruck 1992)<br />
Vol. 16C, 1103 (1992)<br />
[<strong>1.</strong>44] S. Preische, P. C.<br />
Efthimion and S. M. Kaye,<br />
Rev. Sci. Instrum. 68,<br />
409 (1997)<br />
<strong>1.</strong>2 FTU Facilities<br />
Oblique ECE measurements were performed for the first time at FTU. At present, this<br />
is the only oblique ECE diagnostic installed in a fusion device, and the potential of<br />
such a diagnostic appears to be still largely untapped [<strong>1.</strong>43-<strong>1.</strong>44]. High-field<br />
operations on FTU and access to enhanced <strong>confinement</strong> regimes [<strong>1.</strong>42] allow this<br />
diagnostic to have an excellent resolution in configuration and velocity space. This<br />
capability can be exploited to determine the bulk form of the electron distribution<br />
and the transition from the bulk to the tail of the distribution. This would allow a<br />
detailed study of the kinetic processes involved in heating and current drive, in a<br />
variety of transport mechanisms for which at present direct experimental evidence is<br />
lacking.<br />
New data acquisition system for the plasma-density laser interferometer<br />
The two-colour interferometer was developed to get reliable density measurements<br />
during pellet injection experiments. To calculate the density, the signal from the CO 2<br />
detectors, the HgCdTe room-temperature photo resistor and HeNe photodiode has<br />
to be acquired, amplified with the automatic gain control and then compared with<br />
the signal taken from the Bragg cell driver.<br />
A new acquisition system based on a PC with a 5-MHz ADC was installed to increase<br />
the sampling rate of the old system. The system also processes, stores and sends the<br />
signal data and density to the main pulse file (based on the UNIX system) so that<br />
they are available to users through the usual display program (SHOX) (fig. <strong>1.</strong>29).<br />
Fig. <strong>1.</strong>29 - Schematic of<br />
the new PC-based<br />
acquisition system.<br />
The ADC VME module of<br />
the old system was used<br />
to acquire the phase<br />
DAS<br />
comparator outputs. It did<br />
not have enough memory<br />
to acquire the whole<br />
discharge at the correct<br />
sampling rate so, during<br />
pellet injection or fast<br />
machine vibrations, some<br />
fringe jumps were<br />
observed. The problem<br />
was solved by acquiring<br />
CH2<br />
data with a National<br />
Lab View CH1<br />
Instruments NI6110E data<br />
acquisition card that has<br />
high performance, reliable<br />
data acquisition capabilities and high speed. The new program is written in LabView<br />
graphic language.<br />
It is possible to acquire four analog inputs at 5 MS/s, with a 12-bit resolution. Data<br />
are stored on the local hard disk and automatically processed to separate the density<br />
and vibration contributions to the interferometer phase. The data are then<br />
transferred via Ethernet to the main archive under “AFS” using a set of routines<br />
(FTUWIN DLL) for the standard formatting of FTU archive files, via the LabView<br />
program.<br />
Turbulence measurements with correlation reflectometry<br />
Turbulence physics is essential for understanding transport in tokamaks. It is<br />
important to scale turbulence characteristics with the main discharge parameters; the<br />
extension of turbulence measurements to high toroidal <strong>magnetic</strong> fields and densities<br />
can be done in FTU by means of the recently installed correlation reflectometer. The
36<br />
<strong>1.</strong> MAGNETIC CONFINEMENT<br />
<strong>1.</strong>2 FTU Facilities<br />
turbulence characteristics<br />
were measured in<br />
discharges with toroidal<br />
<strong>magnetic</strong> fields of 5.2-8 T,<br />
average densities of 0.35-<br />
3.5x10 20 m -3 and plasma<br />
currents 0.4-<strong>1.</strong>2 MA.<br />
The heterodyne reflectometry<br />
system is similar to<br />
that of T-10 [<strong>1.</strong>45] and<br />
operates in the 53–78 GHz<br />
FTU<br />
frequency band. There are two antenna arrays (fig. <strong>1.</strong>30): the top array consists of<br />
four antennas adjusted to operate in the O-mode and the bottom array has two<br />
antennas to launch an extraordinary wave. It is, therefore, possible to probe the<br />
plasma simultaneously with the O-mode (n e between 0.35 and 0.75×10 20 m -3 ) and<br />
the extraordinary low-frequency (Xl) mode (n e between <strong>1.</strong>4 and 2.9×10 20 m -3 ). One<br />
of the antennas in the top array is used to launch the probing signal and two are used<br />
to receive the incoming signal. The two receiving antennas are separated by 2.5° to<br />
allow poloidal correlation measurements with the O-mode in the full frequency<br />
band. As Q-band waveguides are used for the transmission lines, it is also possible<br />
to work with the top antenna array in the Xl-mode from 60 to 78 GHz, therefore<br />
extending the density range of poloidal correlation measurements to the maximum<br />
critical density of 2.9×10 20 m -3 . A special processor controls the required frequency<br />
variation during the discharge. The minimal sweep time for the whole band is 80 ms.<br />
The amplitude (A) and the phase (ϕ) fluctuations of the reflected electric field vector<br />
are decomposed by a quadrature detector into imaginary (U 1 =A×sinϕ) and real<br />
(U 2 =A×cosϕ) parts. Thus, for each reflectometry channel two signals are recorded<br />
with a sampling rate of up to 2 MHz during the whole discharge. For poloidal<br />
correlation measurements, the signals of two poloidally separated antennas are<br />
synchronously sampled using four ADCs. All signal processing is performed in<br />
complex form. For each time interval of interest, the signals are divided into<br />
subintervals and in each subinterval a complex fast Fourier transform is applied, to<br />
provide the amplitude and the phase spectra for both signals. The absolute values of<br />
the amplitude of the subspectra are then averaged to obtain two final amplitude<br />
spectra (one for each channel). A signal equal to the normalised cross product of the<br />
two complex spectra is also built; the signal is then averaged with the same<br />
procedure as used for the original signals. The results are the cross-phase and<br />
coherency spectra. Auto and cross-correlation functions of the two channels can also<br />
be calculated over each subinterval by averaging over the whole time interval.<br />
17.5°<br />
10.8°<br />
5°<br />
4"O"<br />
mode top<br />
antennas<br />
array<br />
2"X" mode<br />
bottom<br />
antennas<br />
array<br />
Fig. <strong>1.</strong>30 - FTU<br />
reflectometer antennas.<br />
The bottom pair are in<br />
X–mode; the top four, in<br />
O-mode.<br />
[<strong>1.</strong>45] V.A. Vershkov, V.V.<br />
Dreval, S.V. Soldatov,<br />
Rev. Sci. Instr. 70, 1700<br />
(1999)<br />
[<strong>1.</strong>46] V.A. Vershkov, et<br />
al., presented at the 28 th<br />
EPS Conf. on Controlled<br />
Fusion and Plasma Physics<br />
(Madeira 2001), Vol.<br />
25A, p. 1276<br />
[<strong>1.</strong>47] G.D. Conway, et al.,<br />
Phys. Rev. Lett. 84, 1463<br />
(2000)<br />
Figure <strong>1.</strong>31 shows typical results of poloidal correlation measurements of a)<br />
amplitude, b) cross-phase, c) coherency spectra, d) auto-correlation and e) crosscorrelation<br />
functions. The results are similar to those of T-10 [<strong>1.</strong>46] and JET [<strong>1.</strong>47]. The<br />
quasi-coherent fluctuations always rotate in the electron dia<strong>magnetic</strong> drift direction<br />
with velocities of about 2×10 3 m s -1 . Their angular velocity is equal to or slightly less<br />
than that of the m=2, n=1 mode at half radius and decreases significantly towards the<br />
plasma centre. As per expectations, turbulence frequencies are rather high in some<br />
regimes. The broadband fluctuations show frequencies of up to 1 MHz; the quasicoherent,<br />
250 kHz. The estimated poloidal m numbers of the quasi-coherent<br />
fluctuations can be as large as 100. However, in many discharges lower frequencies<br />
and m numbers are also observed, suggesting a more complex dependence of the<br />
wavelengths on the discharge parameters, rather than a simple scaling with the<br />
toroidal <strong>magnetic</strong> field. The cross-phase slope and the cross-correlation function<br />
show that the low-frequency component also rotates in the electron dia<strong>magnetic</strong> drift
<strong>1.</strong> MAGNETIC CONFINEMENT<br />
37<br />
[<strong>1.</strong>48] F. Alladio et al.,<br />
Pressure Anisotropy in<br />
Ohmic FTU Discharges,<br />
presented at the 18 th<br />
European Conf. on Control.<br />
Fusion and Plasma Physics,<br />
(Berlin 1991)<br />
[<strong>1.</strong>49] V.A. Vershkov, et<br />
al., Nucl. Fusion, Iokohama<br />
special issue 2, IAEA, 39,<br />
1775 (1999)<br />
Fig. <strong>1.</strong>31 - Turbulence<br />
behaviour of a typical<br />
FTU discharge: a)<br />
spectrum, b) cross phase,<br />
c) coherency, d) cross<br />
correlation, e) autocorrelation.<br />
The spectrum<br />
consists of three distinct<br />
parts: low frequency,<br />
quasi-coherent and broad<br />
band. The crosscorrelation<br />
function<br />
shows a fast and a slow<br />
rotating structure.<br />
Fig. <strong>1.</strong>32 - Evolution of<br />
turbulence behaviour<br />
during a spontaneous<br />
density peaking event.<br />
Coherency Cross-phase Amplitude<br />
π<br />
a.u.<br />
Amplitude<br />
kHz ω, 104 s-1 a.u. Part in signal cm 1019 m-3<br />
<strong>1.</strong>5<br />
<strong>1.</strong>0<br />
0.5<br />
0.0<br />
1<br />
0.6<br />
0.4<br />
0.2<br />
0.0<br />
-300 -200 -100 0 100 200<br />
0.4<br />
0.2<br />
0.0<br />
<strong>1.</strong>0<br />
0.5<br />
0.0<br />
-100<br />
6<br />
4<br />
2<br />
0<br />
10<br />
0<br />
0.5<br />
0.0<br />
0.4<br />
0.0<br />
0.4<br />
0.0 2<br />
1<br />
0<br />
100<br />
0<br />
0<br />
-1<br />
a)<br />
b)<br />
c)<br />
d)<br />
e)<br />
LF<br />
g)<br />
d)<br />
d)<br />
e)<br />
-12,84 µs<br />
(LF)<br />
QC<br />
-50<br />
300 400<br />
Time (ms)<br />
Frequency kHz<br />
0 50<br />
Time lag, µs<br />
i<br />
Line averaged density<br />
Reflection radius<br />
Broad band<br />
Low Frequency<br />
Quasi-coherent<br />
Angular velocity<br />
Quasi-coherent<br />
frequency<br />
f)<br />
-3.84µs (QC)<br />
500<br />
a)<br />
b)<br />
Cross<br />
correlation<br />
c) c)<br />
Auto<br />
correlation<br />
300<br />
100<br />
<strong>1.</strong>2 FTU Facilities<br />
direction but at a<br />
much lower speed<br />
(about 0.5×10 3 m s -1 ).<br />
This differs from the<br />
T-10 results, where<br />
this component does<br />
not move in the<br />
plasma core.<br />
Distinctive<br />
turbulence behaviour<br />
during a spontaneous<br />
density peaking<br />
“event” [<strong>1.</strong>48] is<br />
shown in figure <strong>1.</strong>32.<br />
A strong decrease in<br />
the quasi-coherent<br />
and broadband<br />
angular velocities<br />
and a simultaneous<br />
increase in the quasicoherent<br />
amplitude<br />
are observed at t=260<br />
ms when the density<br />
starts to rise.<br />
Suddenly, at t=340<br />
ms, this process<br />
reverses and the<br />
rotation of the high<br />
frequencies starts to<br />
increase, together<br />
with a transient<br />
disappearance of the<br />
quasi-coherent component, which<br />
appears again after a few ms at a<br />
much higher frequency. The growth<br />
of the low-frequency amplitude<br />
begins about 10 ms earlier, while its<br />
velocity remains constant. Such<br />
complex turbulence behaviour is very<br />
similar to that observed in T-10<br />
during SOC to IOC transition [<strong>1.</strong>49]<br />
and may be explained by the<br />
formation at the periphery of a<br />
transient velocity shear zone, which<br />
travels towards the centre. It initially<br />
flattens the gradients in the plasma<br />
core and the quasi-coherent velocity<br />
therefore decreases. The shear wave<br />
arrives at the reflecting radius at<br />
t=340 ms, as shown by a steep<br />
velocity rise and by a transient<br />
suppression of the quasi-coherent<br />
component. Note that, in reality, the<br />
low-frequency and quasi-coherent
38<br />
<strong>1.</strong> MAGNETIC CONFINEMENT<br />
<strong>1.</strong>2 FTU Facilities<br />
components may rise simultaneously<br />
if the non-locality of the measurement<br />
is taken into account, since it<br />
integrates the low frequency at some<br />
outer radial zone. It is also important<br />
that the low-frequency rotation<br />
remain unchanged. It is worth noting<br />
that the quasi-coherent rotation is<br />
sensitive to gradients, whereas the<br />
low-frequency is closer to that of the<br />
bulk plasma. Figure <strong>1.</strong>33 shows the<br />
evolution of some turbulence<br />
parameters in an experiment with the<br />
injection of four deuterium pellets<br />
[<strong>1.</strong>50]. The discharge has I p =<strong>1.</strong>2 MA<br />
and B t =7.9 T. The probing Xl mode<br />
was used with a cut-off density of<br />
2.76×10 20 m -3 . The trace of the<br />
reflected wave amplitude (fig. <strong>1.</strong>33b)<br />
shows that reflection appears just<br />
transiently after the first pellet at<br />
t=800 ms and becomes permanent<br />
after injection of the second. This is<br />
eV/cm 104 s-1 Part in signal cm a.u. 1019 m-3<br />
ω rotation<br />
pellets<br />
Electron density<br />
Reflection radius<br />
Broad band<br />
Low frequency<br />
the first time that poloidal correlation measurements in the Xl mode have been<br />
carried out in tokamaks, with the antennas located at the low-field side and the<br />
poloidal angle 17.5° above the equatorial plane. Such geometry results in a<br />
significant deviation of the incident wave from the perpendicular direction, due to<br />
the dependence of the refractive index on the <strong>magnetic</strong> field and on the Shafranov<br />
shift of the plasma column. This makes it impossible to measure reflections close to<br />
the centre of a plasma with a flat density profile. Thus, reliable results can be<br />
obtained only when the amplitude of the reflected wave is larger than some<br />
minimum value, as shown in figure <strong>1.</strong>33b. The most distinctive feature is the drop of<br />
the quasi-coherent rotation velocity after the second pellet. An explanation for this<br />
could be that the reflection layer gradually moves towards the central region where<br />
the gradients are smaller due to density decay. At the same time, the low-frequency<br />
component rotates more slowly and does not show any strong variation in time. This<br />
may indicate again that this component is related to plasma rotation, whereas the<br />
quasi-coherent one depends on gradients. The simultaneous suppression of both<br />
components in the central region, as observed in these experiments, suggests a<br />
physical relation between these turbulence features and also the presence of a good<br />
<strong>confinement</strong> zone near the centre.<br />
The fully non-inductive discharges with LHCD [<strong>1.</strong>51] make it possible to reveal the<br />
fine structure of quasi-coherent turbulence. In figure <strong>1.</strong>34 the usually smooth spectral<br />
maxima of these fluctuations split into an envelope of five peaks with a 3.1-kHz<br />
spacing in frequency. The depth of amplitude modulation shows that only the quasicoherent<br />
fluctuations are 100% modulated whereas the broadband are not. This<br />
supports the idea that the two components have different underlying physical<br />
mechanisms. Poloidal correlation measurements during the same time slice give the<br />
rotation velocity and show that the mean m number is equal to 48. Thus, the 3.1-kHz<br />
frequency step corresponds to an m number increment of three instead of one. In<br />
order to solve this problem, consider the reflection from a plasma region with a flat<br />
current profile around the q=3 surface but with a rather steep density gradient. The<br />
modes with m/n ≠3 will be far away from the reflection layer and will not be “seen”<br />
by the reflectometer. Thus, only modes with an m increment of three will be<br />
observed, in accordance with experimental data. Analysis of the bursting of the<br />
4<br />
2<br />
20<br />
10<br />
0<br />
20<br />
10<br />
0<br />
0.5<br />
0.0<br />
0.2<br />
0.0<br />
<strong>1.</strong>0<br />
0.5<br />
0.0<br />
m=2 HF<br />
Signal amplitude<br />
Reliability level<br />
LF<br />
100<br />
0 dT/dr<br />
700 800 900 1000 1100 1200<br />
Time (ms)<br />
Fig. <strong>1.</strong>33 - Evolution of<br />
turbulence behaviour<br />
during a high-<strong>confinement</strong><br />
phase of a pellet-fuelled<br />
discharge.<br />
[<strong>1.</strong>50] V. Pericoli Ridolfini<br />
et al. , Phys. Rev. Lett. ,<br />
82, 93 (1999)<br />
[<strong>1.</strong>51] S. Cirant et al.,<br />
Mode coupling trigger of<br />
tering mides in ECV<br />
heated discharges in FTU,<br />
presented at the 18 th<br />
IAEA Conference,<br />
(Sorrento 2000), paper<br />
IAEA-CN-77/EX3/3
<strong>1.</strong> MAGNETIC CONFINEMENT<br />
39<br />
Coherency Cross-phase Amplitude<br />
π a.u.<br />
<strong>1.</strong>0<br />
0.5<br />
0.0<br />
1<br />
0<br />
<strong>1.</strong>0<br />
-1<br />
0.5<br />
0.0<br />
-100 -50 0 50 100<br />
Frequency kHz<br />
Fig. <strong>1.</strong>34 - Turbulence spectrum in a discharge with<br />
full LH current drive. The quasi-coherent and lowfrequency<br />
components show a peaked structure.<br />
Fig. <strong>1.</strong>35 - Comparison of<br />
MHD and turbulence<br />
properties in a discharge<br />
with 2/1 island ECRH<br />
stabilisation.<br />
Fig. <strong>1.</strong>36 - Temperature<br />
time trace in discharges<br />
with BT scan used for the<br />
diagnostics comparison.<br />
[<strong>1.</strong>52] D. Frigione et al. ,<br />
Nucl. Fusion 41, 11, 16131<br />
(2001)<br />
Frequency<br />
m=2, kHz<br />
Amplitude<br />
m=2, a.u.<br />
ωrotation<br />
104 s-1<br />
4<br />
3<br />
2<br />
1<br />
0<br />
<strong>1.</strong>5<br />
1<br />
0.5<br />
0<br />
5<br />
4<br />
3<br />
4<br />
2<br />
0<br />
4<br />
2<br />
0<br />
2<br />
1<br />
0<br />
a)<br />
b)<br />
c)<br />
800<br />
T ece<br />
a)<br />
b)<br />
c)<br />
850<br />
T ece /T sc<br />
T sc<br />
B tor<br />
Time (ms)<br />
<strong>1.</strong>2 FTU Facilities<br />
harmonics in time shows that they behave stochastically<br />
and are not correlated. Therefore the conclusion in this<br />
case is that each harmonic is just an independent<br />
excitation of the helical mode with high values of m<br />
numbers.<br />
Important information was obtained in experiments<br />
with m=2, n=1 stabilisation by ECR heating [<strong>1.</strong>52].<br />
Figure <strong>1.</strong>35 shows a comparison of frequency (fig. <strong>1.</strong>35a)<br />
and amplitude (fig. <strong>1.</strong>35b) variation of the m=2, n=1<br />
mode measured with <strong>magnetic</strong> probes and an O-mode<br />
reflectometer. The good agreement is clearly seen. The<br />
angular velocities of the m=2 mode and the quasicoherent<br />
and low-frequency components are compared<br />
in figure <strong>1.</strong>35c. The rotation of the quasi-coherent<br />
component is practically equal to or sometimes<br />
transiently higher than that of the<br />
900<br />
Reflectometer<br />
Magnetic probes<br />
ECRH<br />
Reflectometer<br />
Magnetic probes<br />
MHD<br />
LF<br />
HF<br />
950<br />
0 0.5 1 <strong>1.</strong>5 2<br />
Time (s)<br />
m=2 mode and does not change<br />
after its stabilisation. The lowfrequency<br />
component rotates<br />
slightly more slowly and does not<br />
vary after the m=2 stabilisation<br />
either.<br />
Comparison of ECE and<br />
Thomson scattering temperature<br />
measurements<br />
After upgrading of the Thomson<br />
scattering (TS) system and<br />
realignment of the ECE<br />
optics, with a consequent<br />
re-calibration of the<br />
Michelson interferometer,<br />
the electron temperature<br />
measurements performed<br />
with the two diagnostics<br />
were no longer in<br />
agreement.<br />
To understand which of<br />
the two measurements<br />
was correct, some toroidal<br />
field ramps were<br />
analysed to see if the<br />
discrepancy depended on<br />
the <strong>magnetic</strong> field or on<br />
the temperature itself. In<br />
the first case, the error<br />
could be attributed to the<br />
ECE optics as the emitted spectrum moves at different frequencies when the<br />
<strong>magnetic</strong> field is changed, if there is an error in the calibration. In the second case,<br />
the error can only be due to the TS system since the Michelson measurements are far<br />
from saturation. In the following it is shown that the discrepancy depends strongly<br />
on the <strong>magnetic</strong> field and, hence, is to be attributed to the ECE diagnostics.<br />
The result of a single toroidal field ramp is shown in figure <strong>1.</strong>36. The ECE
40<br />
<strong>1.</strong> MAGNETIC CONFINEMENT<br />
<strong>1.</strong>2 FTU Facilities<br />
temperature (T ECE ) and<br />
the TS temperature (T SC )<br />
2<br />
are in close agreement at<br />
3.4 T, but during the<br />
ramp the discrepancy<br />
<strong>1.</strong>5<br />
between the two<br />
increases. The ratio of<br />
(T ECE) / (T SC ) vs. the<br />
1<br />
<strong>magnetic</strong> field was<br />
plotted for different B T<br />
ramps (fig. <strong>1.</strong>37); here, 0.5<br />
the largest discrepancy<br />
occurs between 5 T and<br />
6 T. This behaviour is<br />
0<br />
reproducible, and the<br />
4 6 8<br />
same results were found<br />
B T<br />
after a new alignment of<br />
the ECE collecting<br />
<strong>1.</strong>8<br />
system. Figure <strong>1.</strong>38<br />
shows the two calibration<br />
campaigns in<br />
<strong>1.</strong>6<br />
different colours. The<br />
data scattering is due to<br />
the statistical noise on<br />
<strong>1.</strong>4<br />
the TS, connected with<br />
fast temperature variations<br />
during sawtooth<br />
<strong>1.</strong>2<br />
activity. The discrepancy<br />
between the two<br />
diagnostics is clearly<br />
1<br />
outside the data<br />
scattering.<br />
0.8<br />
To check that there was<br />
no implicit dependence<br />
on electron temperature,<br />
3 4 5 6<br />
B T<br />
7 8 9<br />
the ratio T ECE /T SC was plotted for fixed <strong>magnetic</strong> 8<br />
field vs. the temperature itself for a number of shots (fig.<br />
<strong>1.</strong>39). The plots show that the discrepancy does not<br />
depend on the electron temperature. In fact, the data<br />
with the highest discrepancy (corresponding to 5-6 T)<br />
6<br />
have an intermediate temperature (light blue points in<br />
fig. <strong>1.</strong>39).<br />
After the above analysis, the ECE data were recalibrated<br />
on the TS temperature, using the smoothed<br />
average curve of figure <strong>1.</strong>38, for all the shots of the<br />
analysis campaign.<br />
Tece/Tsc<br />
Tece/Tsc<br />
Tece<br />
4<br />
2<br />
Fig. <strong>1.</strong>37 - ECE–TS temperature<br />
ratio for<br />
discharges with contiguous<br />
B T scans vs B T .<br />
Fig. <strong>1.</strong>38 - TECE/TSC<br />
ratio vs. the toroidal<br />
<strong>magnetic</strong> field for the<br />
two different calibration<br />
campaigns.<br />
Neutron diagnostics<br />
The detector system based on the NE213 scintillators<br />
used for the six-channel neutron camera was recalibrated<br />
and is now routinely operating. An analysis<br />
program was written in IDL programming language to<br />
provide both neutron emission and ion temperature<br />
0<br />
0 2 4<br />
Fig <strong>1.</strong>39 - ECE temperature vs. TS temperature for<br />
the shots of fig <strong>1.</strong>34.<br />
T sc
<strong>1.</strong> MAGNETIC CONFINEMENT<br />
41<br />
<strong>1.</strong>2 FTU Facilities<br />
profiles from the neutron-camera data. Good agreement was found between the<br />
experimental profiles and the results of transport analysis simulations.<br />
[<strong>1.</strong>53] F.M. Poli, et al.,<br />
Disruption generated<br />
runaways in the FTU high<br />
field tokamak, presented<br />
at 43 rd APS Conference,<br />
(Long Beach 2001)<br />
Disruptions in FTU plasmas were analysed using data from the neutron detectors<br />
(BF 3 chambers). A database was prepared to investigate the dependence of the<br />
photoneutron production on the toroidal field (B T ) and then extended to the results<br />
obtained on other devices (TS, JT-60U) to <strong>magnetic</strong> fields B T > 4 T. Results show that<br />
the generation of runaways is due the Dreicer mechanism and that the increase in<br />
runaway production observed at higher toroidal fields could be due to the effect of<br />
the plasma current profile [<strong>1.</strong>53].<br />
The studies on runaway electrons in FTU continued in collaboration with the<br />
Universidad Carlos III (Madrid). The time evolution of the energy distribution<br />
function of runaway electrons in several FTU discharges was evaluated and<br />
compared with spectral measurements of γ-rays produced by runaway electrons<br />
hitting the limiter/vessel structures.<br />
Tests on organic scintillator neutron detectors (NE213, stilbene and anthracene) were<br />
carried out in collaboration with the TRINITI Institute, Moscow to verify the detector<br />
light outputs. The light-output spectra were acquired using a 137Cs gamma source<br />
and a VME-based acquisition system. The results indicate that stilbene scintillators<br />
have higher light output than NE213 (respectively 82% and 51%, compared to<br />
anthracene).<br />
<strong>1.</strong>3.1 Introduction<br />
<strong>1.</strong>3 Plasma Theory<br />
The plasma theory activities are directed along two major lines of research: direct<br />
support to the FTU research program, in terms of modelling and interpretation of<br />
experimental data; and investigation of more fundamental physics problems<br />
regarding turbulent transport and fast-particle-induced collective effects. In what<br />
follows, the highlights and results of the more basic physics research efforts are<br />
reported.<br />
The theoretical model of ion Bernstein wave (IBW)-induced poloidal rotation was<br />
further developed in the framework of both fluid and kinetic models and reached a<br />
remarkable reliability level in predicting the formation and control of internal<br />
transport barriers (ITBs) for the FTU experiments. The peculiar features of IBWs<br />
makes it possible to achieve significant results at moderate levels of injected power,<br />
as low as a few hundred kWs (sec. <strong>1.</strong>3.2).<br />
To understand turbulent transport, it is crucial to assess the role of self-generated and<br />
time-varying sheared flows (zonal flows) in (self)-regulating the turbulence level.<br />
Section <strong>1.</strong>3.3 addresses this issue with particular attention paid to the role of drift-<br />
Alfvén instabilities. The effect of partial cancellation of the Reynolds vs. Maxwell<br />
stress tensor is discussed.<br />
For the plasma stability studies relevant to ITB formation, new, interesting<br />
investigation tools are available within a novel and unified mathematical<br />
formulation for analysing both “small but finite” and “vanishing” <strong>magnetic</strong> shear<br />
near a minimum-q surface (sec. <strong>1.</strong>3.4).<br />
The <strong>confinement</strong> properties of fusion products and, in general, of fast ions may<br />
deteriorate because of the onset of collective modes of the Alfvén branch. The<br />
stability properties of the modes in reversed shear and “advanced” tokamak<br />
equilibria are analysed in section <strong>1.</strong>3.5. It is shown that energetic particle driven
42<br />
<strong>1.</strong> MAGNETIC CONFINEMENT<br />
<strong>1.</strong>3 Plasma Theory<br />
(EPM) “gap” modes exist as well EPM “resonant” modes, which are generally<br />
excited at different radial locations, depending on the plasma and fast ion<br />
equilibrium profiles.<br />
The dynamic complexity expected from linear stability analyses is reflected in the<br />
richness of the nonlinear behaviour of modes and energetic particle transport.<br />
Section <strong>1.</strong>3.6 gives some highlights from numerical simulations of nonlinear Alfvén<br />
mode dynamics and their effect on fast ion transport. The effectiveness of the<br />
minimum-q surface in acting as an “insulating” layer is discussed, along with the<br />
conditions for observing “avalanches”. The simulations were performed with the<br />
hybrid MHD gyrokinetic code (HMGC) developed in Frascati.<br />
<strong>1.</strong>3.2 IBW-induced poloidal rotation on FTU<br />
IBW absorption near an ion cyclotron resonant layer in a tokamak plasma can<br />
produce ion poloidal shear flows capable of improving plasma <strong>confinement</strong> [<strong>1.</strong>54,<br />
<strong>1.</strong>55]. This effect is provided by IBWs more efficiently than by other waves because<br />
their rf power flux is mainly carried by the kinetic contribution of the coherent<br />
motion of the particles in the wave field. The theoretical model of IBW-induced<br />
poloidal rotation was developed in the framework of both fluid and kinetic analyses<br />
[<strong>1.</strong>56, <strong>1.</strong>57, <strong>1.</strong>58].<br />
Sheared flow can be obtained by solving the compressible fluid momentum balance<br />
equation, which in the case of IBWs is a reasonable starting point:<br />
[<strong>1.</strong>54] M. Ono & PBX-M<br />
Group, Proc. 15 th Inter.<br />
Conf. on Plasma Physics<br />
and Controlled Nuclear<br />
Fusion Research, (Seville<br />
1994), paper IAEA-CN-<br />
60/A-3-I-7<br />
[<strong>1.</strong>55] R. Cesario et al.,<br />
Phys. Plasmas, 8, 4721<br />
(2001)<br />
[<strong>1.</strong>56] L.A. Berry, E.F.<br />
Jaeger, D.B. Batchelor,<br />
Phys. Rev. Lett. 82, 1871<br />
(1999)<br />
[<strong>1.</strong>57] E.F Jaeger, L.A.<br />
Berry, D.B. Batchelor,<br />
Phys. Plasmas 7, 3319<br />
(2000)<br />
[<strong>1.</strong>58] J.R. Mira, D.A.<br />
D'Ippolito, Phys. Plasmas<br />
7, 3600 (2000)<br />
∂ vθ<br />
∂t<br />
rr<br />
+ ∇ •( vv)<br />
= µ neo<br />
vθ<br />
(1)<br />
The brackets denote average over a<br />
<strong>magnetic</strong> surface and over a time<br />
longer than a wave period; µ neo is<br />
the neoclassical viscosity<br />
coefficient, which is mainly<br />
produced by <strong>magnetic</strong> pumping. In<br />
(1), the perturbed velocities are<br />
proportional to the rf electric field<br />
via the mobility tensor. In<br />
performing the following<br />
calculations, it was verified that the<br />
power dissipated by <strong>magnetic</strong><br />
pumping was negligible compared<br />
to the total power absorbed by the<br />
ions.<br />
Figure <strong>1.</strong>40 shows the calculated<br />
poloidal velocity and its spatial<br />
gradient ∂ν θ /∂r, compared with the<br />
expected threshold for turbulence<br />
suppression in the FTU plasma, as<br />
obtained using (1). n ||<br />
-launched<br />
spectra for 0-0, (n ||peak ≥2), 0-π/2<br />
(n ||peak ≥2), and 0-π (n ||peak ≈5,<br />
symmetric spectrum) were taken<br />
into account, assuming the same<br />
launched power (0.5 MW) for all the<br />
νθ (km/s)<br />
8<br />
6<br />
4<br />
2<br />
0<br />
-2<br />
0.30<br />
4ΩH<br />
a) poloidal velocity<br />
∆φ=0<br />
∆φ = π/2<br />
∆φ = π<br />
0.35 0.40<br />
x<br />
∆φ=0<br />
∆φ=π/2<br />
∆φ=π<br />
0<br />
0.30 0.35<br />
b) shearing rate<br />
threshold for<br />
turbulence<br />
suppression<br />
Fig. <strong>1.</strong>40<br />
Fig. <strong>1.</strong>40 - a) Poloidal velocity profile ponderomotively generated by<br />
IBWs and b) its gradient, near the resonant layer. Three waveguide<br />
phasings are considered: 0-0 (solid line); 0-π/2 (dashed line) and 0-π<br />
(dotted line). The solid horizontal line in b) shows the shearing rate<br />
threshold for turbulence suppression; the vertical dotted line, the<br />
location of the hydrogen 4 th ion cyclotron harmonic. 0.5 MW launched<br />
power is considered for all spectra. The rf coupled power is calculated<br />
taking into account the rf power reflection coefficients: 20%, 40%,<br />
60% for ∆φ=π, π/2, 0.<br />
(dνθ /dr) (MHz)<br />
6<br />
5<br />
4<br />
3<br />
2<br />
1<br />
4ΩH<br />
x<br />
0.40
<strong>1.</strong> MAGNETIC CONFINEMENT<br />
43<br />
<strong>1.</strong>3 Plasma Theory<br />
spectra considered. As shown in the figure, the threshold for turbulence suppression<br />
is exceeded near the resonant layer within a few millimetres. The shearing rate<br />
exceeds the threshold by about a factor of 10 for ∆φ=0, 4 for ∆φ=π/2 and 2 for ∆φ=π.<br />
It can be verified that a linear proportionality occurs between the coupled power and<br />
the poloidal velocity. Therefore, the estimated IBW power threshold for turbulence<br />
suppression in FTU is 0.05 MW for the ∆φ=0 spectrum, 0.1 MW for ∆φ=π/2, and 0.25<br />
MW for ∆φ=π.<br />
Turbulence suppression for the IBW-FTU experiment was studied by considering a<br />
kinetic plasma model [<strong>1.</strong>57, <strong>1.</strong>58]. As a result, the shearing rate in FTU is ≈4 MHz<br />
with 0.3 MW of IBW power. This should correspond to a threshold of about 0.05 MW<br />
for turbulence suppression, assuming a linear dependence between poloidal velocity<br />
and IBW power. Therefore, the kinetic threshold is in the range of the threshold<br />
estimated by the fluid model. In conclusion, both kinetic and fluid approaches<br />
indicate that the shearing rate threshold for turbulence suppression can be<br />
sufficiently exceeded by injecting a few hundred kW of IBW power in FTU.<br />
Such power is within the range of the available rf power in the IBW experiment in<br />
FTU (0.5 MW with one antenna, <strong>1.</strong>5 MW with three). Improved <strong>confinement</strong> was<br />
found during the experiment operating at low power (one antenna and one rf<br />
generator at 0.4 MW) [<strong>1.</strong>55]. This result is consistent with turbulence suppression<br />
caused by IBW-induced sheared flow.<br />
<strong>1.</strong>3.3 Generation of zonal flows by drift-Alfvén turbulence<br />
[<strong>1.</strong>59] L. Chen, Z. Lin and<br />
R. White, Phys. Plasmas 7,<br />
3129, (2000)<br />
[<strong>1.</strong>60] L. Chen, Z. Lin, R.<br />
White and F. Zonca, Nucl.<br />
Fusion 41, 747, (2001)<br />
The following work (collaboration with University of California at Irvine) is an<br />
extension and application of a recently developed theory on identifying the major<br />
nonlinear physics processes that may regulate drift-Alfvén turbulence, using a weak<br />
turbulence approach [<strong>1.</strong>59, <strong>1.</strong>60]. Based on the nonlinear gyrokinetic equation for<br />
both electrons and ions [<strong>1.</strong>59, <strong>1.</strong>60], an analytic theory is proposed for nonlinear zonal<br />
dynamics described in terms of two axisymmetric potentials, δφ m,z and δA ||m,z ,<br />
which spatially depend only on a (<strong>magnetic</strong>) flux coordinate.<br />
In the long wavelength limit (spatial scales that are greater than the collisionless skin<br />
depth), the zonal field (current) dynamic is passive and may be consistently<br />
neglected. The role of zonal field dynamics becomes important at short wavelengths<br />
typical of, e.g., electron temperature gradient (ETG) driven modes.<br />
As in the electrostatic case [<strong>1.</strong>59, <strong>1.</strong>60], zonal flows may be spontaneously excited by<br />
drift-Alfvén turbulence, in the form of modulational instability of the radial envelope<br />
of the mode [<strong>1.</strong>60]. From the analytic expression for the growth rate in the long<br />
wavelength limit, the exact cancellation of the Reynolds and Maxwell stress tensors,<br />
and - thus - of the zonal flow, depends on the considered drift-Alfvén branch and,<br />
more specifically, on finite plasma compression and parallel electric field effects.<br />
Plasma compression here is anything that makes the plasma response deviate from<br />
the pure Alfvénic state ω 2 =k ||<br />
2 vA<br />
2 . Finite parallel electric field, meanwhile, is due to<br />
charge separation effects that, in a toroidal plasma, are dominated by <strong>magnetic</strong> drifts.<br />
Specialising to the cases of kinetic Alfvén waves (KAWs) and Alfvén ion temperature<br />
gradient (AITG) driven modes [<strong>1.</strong>60], it can be concluded that zonal flows are<br />
spontaneously excited by such modes only under certain conditions. For KAWs, the<br />
zonal flow growth rate, above the excitation threshold in the pump mode amplitude,<br />
scales linearly with the wave field, i.e., as the square root of the deposited power.<br />
Compression and finite parallel electric field effects are weakening on the<br />
modulational instability and result in a k ⊥ ρ Li scaling in the zonal flow growth rate.<br />
Spontaneous zonal flow excitation in the propagating region of the wave requires
44<br />
<strong>1.</strong> MAGNETIC CONFINEMENT<br />
<strong>1.</strong>3 Plasma Theory<br />
T e (3/4)T i , the zonal flow spontaneous<br />
generation takes place in the wave cut-off region, i.e., with greatly reduced<br />
effectiveness. In the case of AITG, similar conclusions may be drawn on the basis of<br />
the mode dispersion relation [<strong>1.</strong>61]. Compression effects for AITG result in a ≈(1-<br />
ω ∗pi /ω) scaling in the zonal flow growth rate. Thus, spontaneous excitation of zonal<br />
flows by AITG is possible only for ω>ω ∗pi , which is typical of moderately unstable<br />
AITG. For strong instability, detailed analyses still need to be carried out. On the<br />
basis of the analytic dispersion relation, however, it is possible to conclude that -<br />
sufficiently above threshold and for sufficiently low frequency - spontaneous<br />
excitation of zonal flows is inhibited. If confirmed, this fact will have a strong impact<br />
on the anomalous transport associated with AITG.<br />
<strong>1.</strong>3.4 Drift and drift-Alfvén wave structures near a minimum-q<br />
surface<br />
Theoretical investigations of drift and drift-Alfvén mode structures near a minimumq<br />
surface and eigenmode analyses that assume small but finite <strong>magnetic</strong> shear can be<br />
discussed within a unified mathematical formulation. For the sake of clarity, the<br />
problem is studied for the case where toroidal mode coupling can be consistently<br />
neglected. The toroidal problem can be analysed in exactly the same fashion, but<br />
with greater technical complexity.<br />
It is part of common wisdom to assume that, within the usual ballooning formalism<br />
[<strong>1.</strong>62], the translational invariance of radial mode structures breaks down for different<br />
poloidal Fourier modes when <strong>magnetic</strong> shear vanishes. This is evidently true.<br />
However, as shown in [<strong>1.</strong>63, <strong>1.</strong>64], only the separation of spatial scales between<br />
equilibrium quantities and wavelengths is really needed for the analysis of high-n<br />
mode structures. This separation of scales is still valid for high-n modes (n being the<br />
toroidal mode number) both near and at a minimum-q surface, where <strong>magnetic</strong> shear<br />
vanishes by definition. Only this fairly general assumption is made in the following<br />
treatment.<br />
The strength of the formalism employing the separation of scales is based on the fact<br />
that the fast radial scale and the spatial coordinate along the <strong>magnetic</strong> field can be<br />
considered Fourier conjugate variables. This is obvious from the following identities:<br />
[<strong>1.</strong>61] F. Zonca, et al.,<br />
Phys. Plasmas 6, 1917,<br />
(1999)<br />
[<strong>1.</strong>62] J.W. Connor, R.J.<br />
Hastie, and J.B. Taylor,<br />
Phys. Rev. Lett. 40, 396<br />
(1978)<br />
[<strong>1.</strong>63] F. Zonca, Continuum<br />
damping of toroidal<br />
Alfvén eigenmodes in<br />
finite-beta tokamak<br />
equilibria, Ph.D. thesis.<br />
Princeton University,<br />
Plasma Physics Lab.,<br />
Princeton N.J. (1993)<br />
[<strong>1.</strong>64] F. Zonca and L.<br />
Chen, Phys. Fluids B5,<br />
3668 (1993)<br />
'<br />
∂ '<br />
qR0k||; mn , = nq0( r −r0)<br />
⇒i s ; q0<br />
≠0<br />
,<br />
∂κr<br />
''<br />
nq<br />
S<br />
qR0k mn qR0k mn r 0<br />
0 r r0 2 2<br />
∂<br />
'<br />
||; , = ||; , ( ) + ( − ) ⇒ ΩAm<br />
, - ; q<br />
n<br />
22 0 = 0<br />
2 2 ∂κ<br />
r<br />
(2)<br />
Here, the notation r 0 denotes the radial coordinate of the considered flux surface,<br />
where q=q 0 , q’=q 0 ’ , etc. Meanwhile, κ r =(r 0 /m)κ r , s≡r 0 q 0 ’ /q 0 , Ω A,m =nq 0 -m,<br />
S≡√r 0 q 0 ” /q 0 , and δφ m (κr), the Fourier Transform of the fluctuating field δΨ m (r), is<br />
given by<br />
∞<br />
1 ⎛ m ⎞ m<br />
δφm( κr) = ∫ exp i ⎜ κr( r−<br />
r0) ⎟ δψm( r) d ( r−<br />
r0)<br />
2π<br />
−∞ ⎝r0<br />
⎠ r0<br />
(3)<br />
Here, s and S are, respectively, the usual and generalised <strong>magnetic</strong> shear definitions.<br />
Note that for q 0<br />
” < 0 the definition of S would change accordingly and that (2)<br />
assumes Ω A,m =nq 0 -m=0, for q 0 ’ ≠0, as is always possible. From (2) and (3), it is<br />
readily shown that
<strong>1.</strong> MAGNETIC CONFINEMENT<br />
45<br />
<strong>1.</strong>3 Plasma Theory<br />
[<strong>1.</strong>65] L. Chen, Phys.<br />
Plasmas 1, 1519, (1994)<br />
[<strong>1.</strong>66] L.J. Zheng, L. Chen,<br />
and R. A. Santoro, Phys.<br />
Plasmas 7, 2469, (2000)<br />
[<strong>1.</strong>67] F. Zonca and L.<br />
Chen, Phys. Plasmas 7,<br />
4600, (2000)<br />
[<strong>1.</strong>68] H.L. Berk, et al.,<br />
Alfvén cascades in JET<br />
discharges with nonmonotonic<br />
q-profile,<br />
Inter. Fusion Theory<br />
Conference, (Santa Fe<br />
2001), paper 1C54<br />
where Θ m =s 2 and Ω A,m =0 for s≠0, and Θ m =S 2 Ω A,m /n for s=0.<br />
With this formalism, e.g., the vorticity equation for EPM resonant excitation by ion<br />
cyclotron resonance frequency (ICRF) becomes<br />
⎡ 2 2 2<br />
⎤<br />
⎢ ∂ Ω − ΩAm<br />
, 1 Λm<br />
Θ<br />
+<br />
− + m⎥<br />
⎛<br />
⎢ 2<br />
2 2 2 ⎥ ⎜<br />
⎣∂κ Θm<br />
( 1+<br />
κr<br />
) ( 1+<br />
κ ⎝<br />
r ) ⎦<br />
r<br />
2<br />
2 2 ∂<br />
qR0k||; mn , Am , - m 2<br />
∂κ<br />
r<br />
( ) = Ω Θ<br />
Here, Ω≡ω/ω A , ω A =νA/qR 0 , and Λ m describes the fast ion response. The structure<br />
of (3) is very general. The factor Θ m reflects the typical radial width of the mode<br />
structure, ∆r. In fact,<br />
2 2 2<br />
m Ω − ΩAm<br />
,<br />
∆r<br />
≈<br />
r0<br />
Θm<br />
2 ⎞<br />
1+<br />
κr<br />
δφm⎟<br />
=0<br />
⎠<br />
(4)<br />
(5)<br />
(6)<br />
It is then obvious that the largest value of Θ m between s 2 and S 2 Ω A,m /n determines<br />
the radial mode width and the actual form of the mode structure and dispersion<br />
relation. Since (∆ r /r 0 ) 2 ∝|1/m 2 Θ m | may be estimated, the transition from small but<br />
finite shear to zero shear occurs for s 2
46<br />
<strong>1.</strong> MAGNETIC CONFINEMENT<br />
<strong>1.</strong>3 Plasma Theory<br />
present parameters, i.e., at r/a=0.2, 2<br />
0.6<br />
s≡rq’/q=-0.58, q=4.4, α H ≡-R 0 q 2 (dβ/dr), <strong>1.</strong>5<br />
0.4<br />
∆’=0.125, α H =0.515, β H =0.0072, 1<br />
η H =0.395, ν H /ν A =0.43, ρ LH /a=0.019.<br />
0.5<br />
0.2<br />
The fast ion tail distribution function is<br />
0<br />
Maxwelllian in energy, with a pitch<br />
0<br />
angle distribution highly peaked around<br />
-0.5<br />
-0.2<br />
µB 0 /E=1, µ being the <strong>magnetic</strong> moment. -1<br />
Results for the growth rate and the -<strong>1.</strong>5 -0.4<br />
0 0.2 0.4 0.6 0.8 1<br />
mode frequency of the EPM are shown<br />
r/a<br />
in figure <strong>1.</strong>43. It is evident that the range<br />
of unstable mode numbers corresponds well to the experimentally observed modes.<br />
The reason why the mode can be considered a resonantly excited EPM and not a<br />
toroidal Alfvén eigenmode (TAE) is given by the strength of the growth rate, which<br />
is comparable with the gap width. A more articulated explanation of this<br />
interpretation is provided in [<strong>1.</strong>66].<br />
Consider modes localised near<br />
0 1 2 3 4<br />
r 0 (for the present parameters 0.05<br />
0.6<br />
r 0 /a=0.49), where q has a<br />
minimum given by q 0 .<br />
0.04<br />
Consider also a given toroidal<br />
mode number n and a poloidal<br />
0.4<br />
mode number m such that the 0.03<br />
normalised parallel wave<br />
vectors Ω A,m =nq 0 -m0. It is then<br />
0.2<br />
readily demonstrated that the<br />
condition under which<br />
0.01<br />
continuum damping is<br />
minimised is that with 0.00<br />
0.0<br />
–1/2
<strong>1.</strong> MAGNETIC CONFINEMENT<br />
47<br />
<strong>1.</strong>3 Plasma Theory<br />
1<br />
0.8<br />
0.6<br />
0.4<br />
0.2<br />
(m-1,n)<br />
non-local<br />
continuum damping<br />
(m,n)<br />
0<br />
-2 -<strong>1.</strong>5 -1 -0.5 0 0.5 1 <strong>1.</strong>5<br />
x<br />
Fig. <strong>1.</strong>44 - Radial structure Fig <strong>1.</strong>44 of the shear<br />
Alfvén continuous spectrum for the (m,<br />
n) and (m-1, n) modes in the case<br />
1≥Ω A,m +Ω A,m-1 >>-r 0 /R 0 . The value of<br />
q 2 0 R 2 0 k 2<br />
|| is shown vs. S≡√n ” 0 (r-r 0 ). The<br />
frequencies of the (m, n) and (m-1, n)<br />
modes are also shown as they are<br />
expected from (8).<br />
1<br />
0.8<br />
0.6<br />
non-local<br />
continuum damping<br />
2<br />
for ω d >ω B >>ω. Here, λ H =(k ⊥ ν ⊥ )/ω cH , ΘF 0H =(2ω∂/∂ν 2 +k×b•∇<br />
/ω cH )F 0H , F 0H is the fast hydrogen tail distribution function, and<br />
assuming deeply trapped banana orbits [<strong>1.</strong>70], for which the mode<br />
drive is expected to be the strongest. For Ω A,m +Ω A,m-1 >>r 0 /R 0 ,<br />
toroidal coupling between the (m,n) and (m-1,n) modes can be<br />
neglected (see fig. <strong>1.</strong>44). The two modes then satisfy the following<br />
approximate dispersion relations, derived from a variational<br />
principle [<strong>1.</strong>67]:<br />
Sπ<br />
⎛<br />
2n<br />
Λ<br />
⎞<br />
ΩAm<br />
Ω<br />
m<br />
, + = −<br />
/ / ⎜<br />
1<br />
52 12 2<br />
n ⎝S<br />
Ω ⎟<br />
2<br />
Am , ⎠<br />
Sπ<br />
⎛<br />
2n<br />
Λ<br />
⎞<br />
ΩAm<br />
Ω<br />
m<br />
, − = −1<br />
−1 −<br />
/ / ⎜<br />
1<br />
52 12 2<br />
n ⎝S<br />
Ω ⎟<br />
2<br />
Am , −1<br />
⎠<br />
where Λ m-1 ≅>ω; thus, the fast ions are characterised by<br />
negative compressibility, which causes the mode frequency to be<br />
shifted upward, contrary to the general case for which fast ion<br />
compression shifts the mode frequency downward [<strong>1.</strong>65-<strong>1.</strong>67]. For<br />
this reason, only the (m,n) mode can exist just above the local<br />
maximum of the Alfvén continuum at r 0 , but not the (m-1,n) mode<br />
just below the local minimum of the continuum. The condition for<br />
the existence of the (m,n)mode is Λ m /Ω A,m >S 2 /2n, which, as a<br />
consequence of (8) is independent of n [<strong>1.</strong>68] and of the mode<br />
frequency. This condition is a lower bound on the fast hydrogen tail<br />
particle density, and for the present parameters<br />
[S=<strong>1.</strong>54,–n H /(R 0 ∂ r n H )=0.13] it gives n H /n e >3.1%, consistent with<br />
the experimental values (n H /n e =4%). Changing the fast-ion nonresonant<br />
response, the (m-1,n) mode instead of the (m,n) can be<br />
excited [<strong>1.</strong>70].<br />
(9)<br />
0.4<br />
0.2<br />
0<br />
-2 -<strong>1.</strong>5 -1 -0.5 0 0.5 1 <strong>1.</strong>5<br />
x<br />
Fig. <strong>1.</strong>45 - Same as fig. <strong>1.</strong>44 but for<br />
Fig <strong>1.</strong>45<br />
–r 0 /R 0 ≤Ω A,m +Ω A,m-1 ≤r 0 /R 0 .<br />
[<strong>1.</strong>70] F. Zonca, et al.,<br />
Energetic particle mode<br />
stability in tokamaks with<br />
hollow q-profiles, to be<br />
published on Phys. of<br />
Plasmas<br />
2<br />
Since Ω A,m +ΩA ,m-1 →0 + (which may occur when, as in the<br />
experiment, q 0 drops), as in figure <strong>1.</strong>45, toroidal coupling effects<br />
become important. Two branches are still present as in (9), one of<br />
which strongly continuum damped (odd mode [<strong>1.</strong>67]), and the<br />
other (even mode [<strong>1.</strong>67]) satisfying the modified dispersion<br />
relation:<br />
which can be straightforwardly derived from within the theoretical<br />
approach of [<strong>1.</strong>67] in a simple but still relevant limiting case, and where<br />
ε 0 ≡2(r 0 /R 0 +∆’),Ω A,m ≅-1/2. Note that on the left-hand side of (10), the fourth root of<br />
the quantity in parentheses – and not the square root as in the usual TAE case – is<br />
due to the local minimum in the q-profile [<strong>1.</strong>67]. The existence condition for the<br />
nearly undamped mode of (10) is exactly the same as that discussed for (9). Clearly,<br />
in both cases the exponentially small continuum damping, due to the non-local<br />
interaction with the (m,n)mode continuum, and other kinetic damping mechanisms<br />
must be evaluated and compared with the resonant drive associated with fast ions<br />
[<strong>1.</strong>67] before the existence of these modes is demonstrated on a rigorous basis. The<br />
complete expressions of non-local continuum damping and fast ion resonant and non-<br />
⎡<br />
π<br />
ε0<br />
2 4 2 14<br />
⎛<br />
2 Λ<br />
Ω −⎜<br />
⎞⎤<br />
/<br />
S<br />
⎛<br />
n<br />
⎞<br />
Ω −14<br />
/ ⎟ = m −1<br />
⎣⎢ ⎝ ⎠⎦⎥ 32 / 12 / ⎜ 2<br />
2 ⎝ Ω ⎟<br />
n S Am , ⎠<br />
(10)
48<br />
<strong>1.</strong> MAGNETIC CONFINEMENT<br />
<strong>1.</strong>3 Plasma Theory<br />
resonant responses are derived and analysed in [<strong>1.</strong>70]. The same work<br />
gives the complete toroidal dispersion relation, which generalises<br />
(10).<br />
When Ω A,m +Ω A,m-1
<strong>1.</strong> MAGNETIC CONFINEMENT<br />
49<br />
<strong>1.</strong>3 Plasma Theory<br />
ω/ω A0<br />
τ= 132.00<br />
1<br />
0.9<br />
0.8<br />
0.7<br />
0.6<br />
0.5<br />
0.4<br />
0.3<br />
0.2<br />
0.1<br />
0<br />
0 0.1 0.2 0.3 0.4 0.5 0.6 0.7 0.8 0.9 1<br />
r/a<br />
τ<br />
240<br />
r n<br />
H<br />
ω/ω A0<br />
τ= 120.00<br />
1<br />
0.9<br />
0.8<br />
0.7<br />
0.6<br />
0.5<br />
0.4<br />
0.3<br />
0.2<br />
0.1<br />
0<br />
0 0.1 0.2 0.3 0.4 0.5 0.6 0.7 0.8 0.9 1<br />
r/a<br />
τ<br />
192<br />
r n<br />
H<br />
ω/ω A0<br />
τ= 204.00<br />
1<br />
0.9<br />
0.8<br />
0.7<br />
0.6<br />
0.5<br />
0.4<br />
0.3<br />
0.2<br />
0.1<br />
0<br />
0 0.1 0.2 0.3 0.4 0.5 0.6 0.7 0.8 0.9 1<br />
r/a<br />
τ<br />
240<br />
r n<br />
H<br />
205<br />
165<br />
205<br />
170<br />
138<br />
170<br />
135<br />
111<br />
135<br />
100<br />
84<br />
100<br />
65<br />
57<br />
65<br />
30<br />
0 0.1 0.2 0.3 0.4 0.5 0.6 0.7 0.8 0.9 1<br />
r/a<br />
30<br />
0 0.1 0.2 0.3 0.4 0.5 0.6 0.7 0.8 0.9 1<br />
r/a<br />
30<br />
0 0.1 0.2 0.3 0.4 0.5 0.6 0.7 0.8 0.9 1<br />
r/a<br />
Fig. <strong>1.</strong>47<br />
Fig. <strong>1.</strong>47 - (top) Power spectra of scalar potential fluctuations during the nonlinear saturated phase in the<br />
plane (r/a, ω/ω A,0 ) with the Alfvén continuum structure superimposed (black curves) and (bottom) contour<br />
plots of the energetic-ion line density r^n^H ≡(r/a)(ν H (r)/ν H,0 ) in the (r/a,τ) plane, with τ≡ω A,0 τ and ω A,0 the<br />
Alfvén frequency at the plasma centre. Three cases are shown: (left) deeply hollow q profile and flat thermalplasma<br />
density; (centre) deeply hollow q profile and decreasing thermal-plasma density and (right) moderately<br />
hollow q profile and flat thermal-plasma density.<br />
(fig. <strong>1.</strong>47 bottom centre). A much more dramatic effect is obtained by acting on the q<br />
profile. A case characterised by a moderately hollow q profile (q 0 ≈5, q min ≈3.6, q a ≈5)<br />
and a flat thermal-plasma density profile (β H,0 =2.5%) clearly exhibits strong<br />
degradation of energetic particle <strong>confinement</strong>. The reason for this is that, for a given<br />
value of β ’ H , the mode radial width scales, near the q min surface, as 1/√nq", while<br />
the typical orbit size is proportional to q min . Decreasing the hollowness of the q<br />
profile, while taking q 0 and q a as fixed, yields lower q” and larger q min values and<br />
makes both the mode and the orbit widths larger than in the deeply hollow q-profile<br />
case. Moreover, the energetic-ion drive intensity (∝q 2 β H ’) scales as q 2 min . The mode<br />
is then a more efficient scattering source for energetic-ion orbits. This fact and the fair<br />
alignment of the frequency gap at different radial positions make the displaced<br />
energetic ion source effective in destabilising an avalanche of outer poloidal<br />
harmonics (fig. <strong>1.</strong>47 right top and bottom).
50<br />
<strong>1.</strong> MAGNETIC CONFINEMENT<br />
<strong>1.</strong>4 FT3 Conceptual Study<br />
<strong>1.</strong>4.1 Introduction<br />
Table <strong>1.</strong>III - FT3 parameters<br />
The FT3 concept is a proposed<br />
upgrade of FTU, which would<br />
enable studies of sub-ignited<br />
plasma conditions in deuterium<br />
plasmas (Q equiv ≈1-5) with<br />
particular reference to the<br />
collective effects driven by the<br />
fast ions produced by ICRH.<br />
Therefore, FT3 would prepare<br />
the operational scenarios of a<br />
burning plasma experiment by investigating the approach to ignition in the presence<br />
of the relevant dynamics of fast ions.<br />
FT3 is similar to JET from the point of view of dimensionless parameters, but the<br />
expected fusion performances are much higher because of the<br />
higher <strong>magnetic</strong> field B (the triple product nTτ is proportional to<br />
B at fixed dimensionless parameters). Indeed, the expected fastparticle<br />
parameters in FT3 at maximum performance are closer to<br />
those of a burning plasma experiment than the parameters<br />
achievable on JET at maximum performance. Note also that FT3<br />
has greater shaping flexibility at maximum plasma current than<br />
JET.<br />
The large range of <strong>magnetic</strong> field values achievable in FT3<br />
includes the ITER <strong>magnetic</strong> field value, so the proposed device<br />
would be a natural test bed for the development of ITER<br />
diagnostics and of auxiliary heating systems such as ECRH.<br />
Table <strong>1.</strong>III reports the main engineering parameters.<br />
B(T)/I(MA) 8/6<br />
P aux (MW) (ICRH/ECRH/LH) 25 (20/3.2/6)<br />
R(m) <strong>1.</strong>3<br />
a(m)/b(m) 0.48/0.9<br />
κ/δ≅I=6MA <strong>1.</strong>8/0.6<br />
t flat-top (s) ≅8T 4<br />
Three main operational scenarios are envisaged: single X-point<br />
(fig. <strong>1.</strong>48) at 8 T/6 MA for investigating H-mode and ITB<br />
formation at high <strong>magnetic</strong>-field and density; limiter scenario at 8<br />
T/7 MA to study enhanced L-mode regimes; single X–point at 5T/2.4 MA for longpulse<br />
scenarios and advanced tokamak physics. H-mode plasmas are expected to<br />
achieve an equivalent Q between Q = 1 and Q = 2, whereas the formation of an ITB<br />
could allow an equivalent Q in the range Q=5.<br />
Fig. <strong>1.</strong>48 - FT3 single-null<br />
equilibrium at B=8 T and<br />
I= 6MA.<br />
<strong>1.</strong>4.2 Main objectives of the FT3 scientific programme<br />
• Investigation of fast-ion collective effects in the parameter range relevant for<br />
burning plasmas. The fast-particle concentration achievable with 20-MW ICRH is<br />
sufficient for studying the destabilisation of resonant collective modes, such as<br />
fishbones and energetic particle modes (EPMs), which are in principle the most<br />
dangerous fast-particle collective effects. Investigation of these effects in negative<br />
<strong>magnetic</strong> shear discharges at B = 5 T will allow a better understanding of the role of<br />
these instabilities in advanced scenarios. Note that these regimes are obtained on FT3<br />
at a slowing down time/energy <strong>confinement</strong> time ratio comparable to that of a<br />
burning plasma experiment.<br />
• Test of H-mode threshold at high <strong>magnetic</strong> field. FT3 could prove the validity of<br />
the most recent scaling law for the L-H threshold (fig. <strong>1.</strong>49), which predicts a lower<br />
threshold power on ITER than the IPB98 scaling. This would facilitate making a final<br />
decision on the auxiliary heating systems of ITER. Note that JET data are consistent<br />
with both expressions of the L-H threshold and cannot provide a definitive answer.
800<br />
<strong>1.</strong> MAGNETIC CONFINEMENT<br />
51<br />
Fig. <strong>1.</strong>49 - H-mode<br />
threshold. Experimental<br />
points compared with the<br />
empirical scaling law. The<br />
FT3 H-mode threshold<br />
has a factor of two range<br />
of variation. An<br />
assessment of the power<br />
threshold could allow an<br />
earlier decision on the<br />
auxiliary heating systems<br />
of ITER.<br />
10<br />
1<br />
0.1<br />
C-Mod a<br />
ASDEX<br />
AUG<br />
COMPASS<br />
DIII-D<br />
JET<br />
JFT-2M<br />
JJT-60U<br />
PBXM<br />
TCV<br />
W=1<br />
0.1<br />
RMSE (%) = 27.8<br />
<strong>1.</strong>0<br />
0.054n s<br />
0.40B T<br />
0.05S0.84<br />
Fig. <strong>1.</strong>50 - FT3 load<br />
assembly.<br />
<strong>1.</strong>4 FT3 Conceptual Study<br />
• Test of H-mode operation in near burning-plasma-experiment conditions.<br />
H–mode data from high-field tokamaks and ICR-heated devices show very low edge<br />
activity [e.g. the enhanced D α (EDA) mode in C-MOD]. On the contrary, H-mode<br />
operation in neutral-beam-heated devices (the main source of heating in most<br />
tokamaks) exhibits strong Type-I edge-localised mode activity that is not compatible<br />
with divertor operation on ITER. FT3 could allow complete characterisation of these<br />
regimes.<br />
• Investigation of enhanced L-mode regimes. Recent FTU results show that quasistationary<br />
pellet enhanced performance (PEP) modes can be achieved with<br />
significant <strong>confinement</strong> improvement. The extrapolability of this regime to burning<br />
plasma experiments requires the development of deep fuelling techniques, which<br />
can be tested on FT3. The formation of radiative improved (RI) modes in highdensity<br />
plasmas has not yet been demonstrated. Since the<br />
radiated fraction increases with density, the achievement<br />
of RI modes requires that a sufficient edge dilution be<br />
reached before radiative collapse takes place. Both the PEP<br />
and the RI mode are interesting for a burning plasma<br />
experiment.<br />
• Achievement of ITB at high <strong>magnetic</strong> field. Steady-state<br />
conditions on the plasma current redistribution time scale<br />
can be achieved on FT3 at B=5 T in less than 5 s. Fully noninductive<br />
operation can be obtained at plasma currents of<br />
<strong>1.</strong>6 MA with a bootstrap fraction of the order of 70%. Thus,<br />
advanced tokamak scenarios could be investigated on FT3<br />
at the ITER density and <strong>magnetic</strong> field values.<br />
• Investigation of scrape-off-layer physics. Plasma<br />
detachment from the divertor plates is expected at<br />
10.0<br />
densities well below the Greenwald limit in compact, high<br />
<strong>magnetic</strong> field experiments. These conditions could be<br />
studied in FT3 at values of the divertor similarity<br />
parameter P/R of the order of those of JET and ASDEX-U,<br />
with P being the power flowing in the scrape-off layer and R the major radius. An<br />
open divertor configuration is foreseen for FT3 to be able to comply with the highly<br />
localised heat fluxes expected in X-point plasmas without reducing the flexibility of<br />
the equilibrium configuration.<br />
Vacuum<br />
Chamber<br />
1400<br />
FW<br />
ICRH<br />
antennas<br />
Support<br />
legs<br />
5800<br />
P10<br />
Technical<br />
structure<br />
P11<br />
P14<br />
5000<br />
- FTIII<br />
C.R.E. Frascati ERG-FUS-TN-MC<br />
Toroidal<br />
Field Coils<br />
Central Solenoid<br />
External Poloidal<br />
Field Coils<br />
Cryostat<br />
Meridian<br />
cross-section<br />
02/12/2000<br />
FT3 is a cryogenic device, like<br />
FTU. However, cooling is by He<br />
gas at 30K, thus allowing a<br />
substantial reduction in dissipated<br />
power. The magnet is fed by the<br />
grid (available power about 45<br />
MW) and by the existing motor<br />
flywheel generator (MFG1). The<br />
toroidal magnet design is based on<br />
the experience gained from the<br />
previous FT and FTU devices and<br />
from the IGNITOR project. The<br />
poloidal field system should give<br />
sufficient flexibility to the<br />
<strong>magnetic</strong> configuration. The<br />
central solenoid has been designed<br />
so as to allow segmentation. The<br />
FT3 load assembly is shown in<br />
figure <strong>1.</strong>50; the divertor
52<br />
<strong>1.</strong> MAGNETIC CONFINEMENT<br />
<strong>1.</strong>4 FT3 Conceptual Study<br />
configuration, in figure <strong>1.</strong>5<strong>1.</strong> The vacuum<br />
vessel is stainless steel to reduce activation.<br />
Indeed, FT3 is expected to produce more than<br />
10 17 neutrons per shot at maximum<br />
performance.<br />
The proposed upgrade can make full use of all<br />
Target Plate<br />
the buildings, power supply and auxiliary<br />
heating systems as well as the diagnostics of<br />
FTU. FT3 will be installed in the FTU hall. A<br />
limited upgrade of the existing MFG3 from 200<br />
to 330 MJ deliverable energy is necessary. The<br />
LH heating and the CD system (8 GHz, 6 MW)<br />
can be adapted to the FT3 port. The driven<br />
current is in the range 0.7-1 MA at n=10 20 m -3 .<br />
A limited upgrade of the ECH system (140 GHz<br />
3.2 MW) is envisaged to allow a longer pulse length at a power capable of stabilising<br />
neoclassical tearing modes. All the FTU diagnostics can be adapted, with minor<br />
modifications, for use on FT3. New diagnostics have to be built for the X-point<br />
measurements and the plasma current profile measurement by the motional Stark<br />
effect.<br />
Support Structure<br />
Vacuum Vessel<br />
Fig. <strong>1.</strong>51 - FT3 open<br />
divertor configuration.<br />
The most important upgrade in additional heating capability is the ICRH system<br />
(tunable in the range 70-90 MHz, 20 MW at the plasma), which will provide the fastparticle<br />
component in the H minority scheme at B=5 T and in the He 3 minority<br />
scheme at B=8 T.<br />
The FT3 construction and assembly is expected to last five years. The total cost is<br />
estimated to be about 100 MEURO.<br />
<strong>1.</strong>5 PROTO-SPHERA<br />
<strong>1.</strong>5.1 Introduction<br />
Chandrasekhar-Kendall-Furth (CKF) <strong>magnetic</strong> configurations are a<br />
novel approach to <strong>magnetic</strong> <strong>confinement</strong> fusion research. They are<br />
simply connected axisymmetric plasma equilibria containing a<br />
<strong>magnetic</strong> separatrix with ordinary X–points (B≠0). The <strong>magnetic</strong><br />
separatrix divides a main spherical torus, two secondary tori on the<br />
top and bottom of the main torus and a spheromak discharge<br />
surrounding the three tori. Two degenerate <strong>magnetic</strong> X-points (B=0)<br />
are present on the symmetry axis at the edge of the configurations<br />
(fig. <strong>1.</strong>52).<br />
Whereas CKF force-free fields cannot sustain any pressure gradient<br />
(∇ → ∧Β → →<br />
=0) and have a relaxation parameter µ=µ 0 j •Β → /B 2 constant<br />
all over the plasma, unrelaxed ((∇ → ∧Β → ≠0, (∇ → ∧Β → ≠0) CKF equilibria<br />
can be calculated with the boundary condition that µ=µ → 0 j •Β → /B 2<br />
is constant only at the edge of the plasma. The surface-averaged<br />
value =µ 0 < → j •Β → /B 2 > will decrease from the edge of the<br />
surrounding spheromak to the axis of the main spherical torus.<br />
ST<br />
I ST<br />
CKF < β > ST = 102%<br />
S P<br />
I e<br />
Spherical<br />
Torus<br />
Secondary<br />
Torus<br />
Surrounding<br />
Discharge<br />
If the spheromak discharge is sustained by driving current along its<br />
closed flux surfaces, <strong>magnetic</strong> helicity, flowing down the gradient, will be<br />
injected into the main spherical torus through <strong>magnetic</strong> reconnections at the X-<br />
points. The gradient of the pressure profile will presumably be concentrated in the<br />
Fig. <strong>1.</strong>52 - Unrelaxed CKF<br />
configuration.
<strong>1.</strong> MAGNETIC CONFINEMENT<br />
53<br />
<strong>1.</strong>5 PROTO-SPHERA<br />
b)<br />
<strong>1.</strong>6<br />
a)<br />
p (a.u.)<br />
µ (m-1)<br />
1<br />
0<br />
20<br />
0<br />
3<br />
c)<br />
d)<br />
IST/Ie<br />
10<br />
5<br />
0<br />
P<br />
UNSTABLE<br />
ST UNSTABLE<br />
STABLE<br />
1 <strong>1.</strong>5 2 2.5 3 qst<br />
0<br />
Fig. <strong>1.</strong>54 - Ideal MHD stability plot for β=1<br />
unrelaxed CKF configuration, expressed in terms<br />
of the safety factor on the spherical torus<br />
<strong>magnetic</strong> axis q 0<br />
ST and of the ratio of currents<br />
I ST /I e .<br />
<strong>1.</strong>8<br />
2.0<br />
3.0<br />
4.0<br />
qst<br />
95<br />
q<br />
0<br />
0.3<br />
R(m)<br />
0<br />
0<br />
Fig. <strong>1.</strong>53 - Unrelaxed CKF configuration, with<br />
I ST /I e =3. a) Flux coordinates and profiles on<br />
equatorial plane of b) pressure, c) and d) safety<br />
factor q.<br />
0.2<br />
R(m)<br />
same region where the gradient of has the largest<br />
variation (see fig. <strong>1.</strong>53).<br />
Unrelaxed CKF equilibria with this kind of and<br />
pressure profiles are stable to all ideal MHD<br />
perturbations with low toroidal mode number (n=1,<br />
2, 3), up to unity plasma beta values,<br />
β=2µ 0 Vol / Vol ≈1 (fig. <strong>1.</strong>54).<br />
Unrelaxed CKF fusion reactors with the right helicity injection, β limit and energy<br />
<strong>confinement</strong> will allow an unimpeded outflow of a part of the high-energy charged<br />
fusion products. The charged fusion products will drift across the <strong>magnetic</strong><br />
separatrix to the degenerate <strong>magnetic</strong> X-points (B=0) on the top/bottom of the<br />
configuration, easing direct energy conversion and the use of a burner as a space<br />
thruster.<br />
The high plasma β≈1 opens the possibility that plasma motions, i.e., radial electric<br />
fields, can sustain the <strong>magnetic</strong> field of CKF configurations. In the case of a CKF<br />
fusion reactor, the radial electric field can even be the natural result of losses of<br />
charged fusion products. To begin an experimental study of unrelaxed CKF<br />
configurations, a preliminary experiment is being proposed. The PROTO-SPHERA<br />
experiment will study the properties of a CKF configuration where a hydrogen forcefree<br />
screw pinch, fed by electrodes, replaces in part the surrounding spheromak<br />
discharge, while poloidal field coils replace the secondary tori. PROTO-SPHERA,<br />
with a longitudinal pinch current I e =60 kA, will produce a spherical torus of<br />
diameter 2×R sph =70 cm, aspect ratio A=<strong>1.</strong>2-<strong>1.</strong>3 and toroidal current I ST =120-240 kA.<br />
<strong>1.</strong>5.2 Mechanical engineering<br />
PROTO-SHERA was designed in detail to define the load assembly (fig. <strong>1.</strong>55). Table<br />
<strong>1.</strong>IV gives the main engineering parameters of the machine. The plasma pulse<br />
duration of 1 s and the inter-pulse time of 5 min are key data. The machine is<br />
designed to operate at room temperature with a vacuum of ~1×10 -8 mbar. It can be<br />
baked up to ~90°C.<br />
Figure <strong>1.</strong>55 shows the key components of the machine: electrodes (anode, cathode),<br />
coils, support structure and divertor plates, together with the protection plates that<br />
shield the coils from the hot electrodes.<br />
The vacuum vessel is 2 m in diameter and 2.5 m high, with a thickness of 18 mm. It
54<br />
<strong>1.</strong> MAGNETIC CONFINEMENT<br />
<strong>1.</strong>5 PROTO-SPHERA<br />
fl 2000<br />
Insulation<br />
Anode<br />
Support<br />
Structure<br />
Type<br />
coils B<br />
Divertor<br />
plates<br />
Type<br />
coils A<br />
Fig. <strong>1.</strong>55 - PROTO-<br />
SPHERA load assembly.<br />
Protection<br />
plates<br />
Cathode<br />
Table <strong>1.</strong>IV - Machine parameters<br />
Spherical torus diameter<br />
0.7 m<br />
Longitudinal screw pinch current<br />
60 kA<br />
Toroidal spherical torus current<br />
120-240 kA<br />
Plasma pulse duration<br />
1 s<br />
Minimum time between two pulses (duty cycle)<br />
5 min.<br />
Maximum heat loads in divertor first-wall components ~2 MW/m 2<br />
Maximum heat loads on rest of first wall<br />
3 MW/m 2 , for 1 ms<br />
Maximum current density on plasma-electrode interface 1 MA/m 2<br />
has a flat 30-mm top, and bottom flanges for all services, while the diagnostic and<br />
vacuum ports are in the main body.<br />
The poloidal field coils are water-cooled vacuum-impregnated OFHC Cu to<br />
accommodate the 5-min duty cycle of the machine. Type A coils (fig. <strong>1.</strong>55) have<br />
currents varying with time during plasma evolution and thin (<strong>1.</strong>5-mm Inconel)<br />
casings; type B coils have constant currents in thick (10-mm stainless steel) casings.<br />
The anode of the machine is made mainly from Cu, with replaceable WCu modules<br />
to allow for the hotspots. The anode consists of six sectors with five modules per<br />
sector. There are also 600 holes (10-mm-diam.) in total to accommodate the gas flow
<strong>1.</strong> MAGNETIC CONFINEMENT<br />
55<br />
<strong>1.</strong>5 PROTO SPHERA<br />
required. The total energy deposited per shot is estimated to be<br />
4 MJ. Although local hot spots around the anode holes of<br />
~1000°C are expected, the main body of the anode reaches<br />
much lower temperatures.<br />
Figure <strong>1.</strong>56 shows the cathode with the W spiral, supported via<br />
Mo dispensers on the Cu cathode body. The cathode consists of<br />
six sectors, with 24 dispensers per sector. Each dispenser holds<br />
three spirals. The maximum temperature in a spiral is expected<br />
to be ~2750°C, while the cathode main body reaches<br />
temperatures much lower than 1000°C. The total energy<br />
deposited in this component is ~ 8 MJ per shot.<br />
Fig. <strong>1.</strong>56 - View of cathode.<br />
PROTO-SPHERA allows the 12 MJ deposited in the electrodes<br />
in each shot to be safely accommodated within the 5-min<br />
machine duty cycle.<br />
Special attention was paid to the protection components (fig. <strong>1.</strong>56), which are water<br />
or inertially cooled to shield the coil insulation from the heat flux coming from<br />
cathode.<br />
The electro<strong>magnetic</strong> forces and stresses during plasma evolution and disruptions<br />
were analysed. The Cu protection plates and the stainless-steel divertor plates were<br />
cut to limit the EM loads.<br />
The assembly has been designed to facilitate access and maximise the space for<br />
diagnostics.
2. IGNITOR PROGRAM 59<br />
2.1 Introduction<br />
Pre-eminent among the significant events affecting the IGNITOR Project in 2001<br />
were the conclusions of the scientific debate initiated by the US fusion community<br />
when the U.S. withdrew from the ITER Project. These conclusions were summarised<br />
in the final report presented by the Fusion Energy Science Advisory Committee<br />
(FESAC) of the Department of Energy (DOE) [2.1]. The objective of the report was to<br />
provide the basis for proposing a programme for the next burning plasma<br />
experiment in the United States. The FESAC report clearly states that the only<br />
<strong>magnetic</strong> configuration sufficiently developed at this time to serve as a burning<br />
plasma experiment is the tokamak, and that all three burning plasma experimental<br />
designs today under development worldwide (IGNITOR, ITER-FEAT and FIRE)<br />
would deliver a large and significant advance in the understanding of burning plasma. This<br />
is an outstanding acknowledgement, at high international level, of the relevance of<br />
IGNITOR.<br />
[2.1] FESAC Panel Report<br />
on Burning Plasma Physics,<br />
Sept. 2001<br />
[2.2] G. Cenacchi, et al.,<br />
Bull. Am. Phys. Soc. 46,<br />
272 (2001)<br />
[2.3] A. Airoldi,et al., Bull.<br />
Am. Phys. Soc. 46, 271<br />
(2001)<br />
[2.4] G. Cenacchi, A.<br />
Airoldi: Equilibrium configurations<br />
for the<br />
Ignitor experiment, IFP<br />
report FP 01/1 (February<br />
2001)<br />
At <strong>ENEA</strong>, the design of the IGNITOR machine is sufficiently detailed to start the<br />
procurement of systems and components, once the Italian Government assures the funds<br />
for its construction and <strong>ENEA</strong> starts the licensing procedure. Meanwhile, the design work<br />
on this very compact, heavily loaded machine is being constantly updated to incorporate<br />
the latest progress in theoretical knowledge and experimental results in operating<br />
tokamaks. Technical specifications were issued to define the activity to be carried out with<br />
the support of industry and to update and revise the design of the main systems and<br />
components, and the relative contract is presently under negotiation with Ansaldo. In<br />
2001, the design activities concerned studies on the machine flexibility and advanced<br />
scenarios, the effect of new disruption data, the development of simplified engineering<br />
models for stress analysis of the nuclear core, plasma-wall interaction and impurity<br />
production studies and the design of the auxiliary ion cyclotron resonance heating (ICRH)<br />
system.<br />
2.2.1 Advanced scenarios<br />
2.2 Physics<br />
The poloidal field system is formed of 13+13 coils, symmetrically located relative to<br />
the machine equatorial plane and independently powered. The system is very<br />
flexible and allows X-point configurations as well as the limiter configurations of the<br />
reference scenario. Preliminary analyses, carried out with the equilibrium-transport<br />
code JETTO, concerned the possibility of obtaining high <strong>confinement</strong> conditions (the<br />
so-called “H-mode”) in the presence of double-null configurations around 10 MA<br />
and with auxiliary heating. The threshold power required for the L- to H-mode<br />
transition, evaluated according to the ITER scaling, is within the limits of the<br />
auxiliary heating system already included in the machine design [2.2]. The flat-top<br />
phase of the nominal IGNITOR scenario was analysed for situations in which a high<br />
impurity content delays ignition and leads to the development of sawtooth-type<br />
MHD instabilities [2.3].<br />
The MHD equilibrium configurations supporting the 11-MA 13-T IGNITOR scenario<br />
were carefully revised. The poloidal field coil currents required throughout the<br />
plasma evolution, from start-up to ignition, were determined both for the reference<br />
conditions and for the advanced scenario with the double null 10-MA configuration.<br />
Equilibrium configurations were obtained for both cases [2.4].<br />
2.3 Engineering of the Machine<br />
2.3.1 EM analysis of vacuum vessel during plasma disruptions<br />
The global forces induced on the IGNITOR vacuum vessel during plasma<br />
disruptions were estimated more precisely on the basis of the JET and Alcator C-Mod
60<br />
2. IGNITOR PROGRAM<br />
2.3 Engineering of the Machine<br />
disruption database. A disruption<br />
simulation was performed, taking into<br />
account the most dangerous EM<br />
transient that could be predicted for the<br />
machine. Figure 2.1 shows the<br />
behaviour vs. time of the macroscopic<br />
plasma-parameters, as well as the<br />
resultant vertical force on the vessel<br />
and the separate contributions to the<br />
total force, due to halo and eddy<br />
currents. The input excitation from this<br />
simulation will be used for the 3–D EM<br />
analysis of the plasma chamber.<br />
I (MA),R(dm),q95<br />
15<br />
10<br />
5<br />
R centre<br />
I plasma<br />
q 95<br />
Z centre<br />
F z (eddy)<br />
Fz(halo)<br />
F z (eddy+halo)<br />
0<br />
-15<br />
0 5 10 15 20 25 30 35<br />
Time (ms) q 95 =2.0<br />
0<br />
-5<br />
-10<br />
Fig. 2.1 - Behaviour vs.<br />
time of the macroscopic<br />
plasma-parameters.<br />
2.3.2 Engineering models<br />
A flexible 2/3-D code for the structural analysis of the nuclear core (vacuum vessel,<br />
toroidal and poloidal field coils, structural supports and bracing rings) is being<br />
developed at <strong>ENEA</strong>. The model allows easy parametric analysis of different<br />
machine operating conditions, optimisation of tolerances, and provides a helpful<br />
instrument for the solution of possible non-conformities arising during component<br />
manufacturing.<br />
The first part, i.e., the models for the <strong>magnetic</strong> fields, <strong>magnetic</strong> forces and<br />
temperature calculations of the IGNITOR poloidal coils, was completed. The EM<br />
model computes forces and temperatures during normal operating conditions as<br />
well as during dynamic events, such as disruptions and faults. The thermal model<br />
includes the magneto-resistance effects, real geometry and the insulation of each<br />
turn in each coil. As an example, the modelled components (plasma current<br />
threads, plasma chamber, poloidal and press coils) are shown in figure 2.2; and the<br />
results of a thermal calculation of the inner poloidal coils, at the end of the 12-MA<br />
13-T scenario, in figure 2.3. No temperature produces any internal stress in the coils<br />
that exceeds the allowable.<br />
Fig. 2.2 - FEM models of plasma current threads, plasma chamber, poloidal and<br />
press coils.<br />
Fig. 2.3 - Temperatures in<br />
central solenoid at the<br />
end of the 12-MA 13-T<br />
scenario.
2. IGNITOR PROGRAM 61<br />
2.3 Engineering of the Machine<br />
2.3.3 Plasma-wall interaction and molybdenum contamination<br />
[2.5] C. Ferro, et al., Proc.<br />
28 th EPS Conf. on<br />
Controlled Fusion and<br />
Plasma Physics, (Madeira<br />
2001), Vol 25A, p. 2121<br />
An investigation [2.5] was carried out by <strong>ENEA</strong> in cooperation with Plasma Surface<br />
Engineering Inc., Canada to study plasma interaction with the wall and the<br />
molybdenum material released into the plasma. At high plasma density, i.e., at high<br />
edge collisionality and with a scrape-off layer that is nearly opaque for neutrals<br />
(IGNITOR operational conditions), the limiter operation develops poloidal gradients<br />
in the plasma temperature and density. Such behaviour, which allows a reduction in<br />
the plasma temperature immediately adjacent to surfaces, is usually assumed to<br />
occur only in the divertor devices. Since sputtering yields are strongly dependent on<br />
particle energies, a very large reduction in sputtering rates can be obtained from a<br />
modest reduction in plasma temperature. The Edge of IGNITOR (EDI) code (a 2-D<br />
Monte Carlo code that models the hydrogenic neutral transport of IGNITOR)<br />
confirmed the above characteristics for the IGNITOR boundary plasma. The code<br />
has also shown that, even with 30 MW of power entering the boundary, the electron<br />
temperature close to the limiter surface can be reduced and sputtering suppressed.<br />
In addition, the large-area limiter is very effective in keeping the peak power density<br />
at low levels, even in discharges with a low level of radiation. At moderate and high<br />
density, the EDI code predicts the formation of an inner-wall MARFE, which will<br />
spread the power, via radiation, to an even greater extent. This result is very similar<br />
to experimental observations in other tokamaks, particularly Alcator C-Mod.<br />
2.3.4 Auxiliary plasma heating system: ICRH<br />
The characteristics, operational parameters and components of an auxiliary heating<br />
system were defined. The system, equipped with 6 antennas, is capable of delivering<br />
up to 18 MW of power, with an Ohmic efficiency of about 90%; the power levels<br />
actually employed will depend on the operational scenario.<br />
Antenna geometry. The antenna, housed in a port (“launcher”, fig. 2.4), consists of two<br />
pairs of poloidally-directed straps. Each strap is fed by a coaxial line at one end and<br />
short-circuited to the vacuum vessel at the other. The basic operation requires phase<br />
reversal of the feed currents in each poloidal pair, to drive an equi-directed poloidal<br />
current along the two straps. To achieve higher efficiency and to increase power<br />
handling capabilities, two strap pairs are aligned toroidally in each port, with<br />
variable relative phase. As the coaxial lines occupy the central part of the antenna,<br />
slanted feeders are used to connect the poloidal sections of the straps to the feeding<br />
points. The Faraday shield is made of a metal frame on which a single layer of metal<br />
rods aligned with the static <strong>magnetic</strong> field lines is attached.<br />
Feeding system. Each strap is independently fed and energized by a generator with a<br />
rf driver and a power amplifier. Each feeding coaxial line is<br />
matched to the power amplifier via a tuning and matching<br />
system composed of two stubs and a line stretcher (“trombone”);<br />
an additional decoupling system is planned between adjacent<br />
straps. The rf drivers of the amplifiers are properly phased to<br />
achieve the required phasing by means of a phase-locking<br />
system. This system is also compatible with automatic matching<br />
to the plasma, which may include variations in frequency and in<br />
the stub and line-stretcher lengths.<br />
Fig. 2.4 - ICRH antenna.<br />
Power handling. The strap design shows a low fraction of reactive<br />
electric energy storage in the operating frequency range.<br />
Considering a conservative estimate of 35 kV for an overall<br />
breakdown voltage in the system, each strap feeding a<br />
subsystem can withstand a power of 1 MW in the entire<br />
frequency range.
3. FUSION TECHNOLOGY 65<br />
3.<strong>1.</strong>1 Introduction<br />
3.1 Technology Programme<br />
In 2001, <strong>ENEA</strong> contributed to the Next-Step and Long-Term Programmes, the Power<br />
Plant Conceptual Studies and Underlying Technology, in the framework of the<br />
European Fusion Technology Agreement (EFDA).<br />
The activities covered almost all the R&D fields: vesssel in-vessel (blanket, first wall<br />
and divertor, remote handling, fuel cycle); magnets (conductor development, coil<br />
tests); safety (including site and socio-economic studies); physics integration<br />
(neutron diagnostics); long-term activities (breeding materials; structural materials,<br />
liquid metal technology, helium-cooled components, IFMIF).<br />
Further to the fusion activities, some valuable applications were developed in the<br />
field of nuclear detectors. Experimental campaigns were carried out on new<br />
hydrogen energy and plasma-focus studies.<br />
The technology activities were performed at the Frascati and Brasimone laboratories,<br />
with valuable contributions from other <strong>ENEA</strong> laboratories. Significant industrial<br />
collaborations were also established.<br />
It is worth mentioning that the three patents granted in 2001 resulted from the R&D<br />
activities.<br />
3.2 First Wall and Divertor<br />
3.2.1 Influence of manufacturing heat cycles on CuCrZr properties<br />
(ITER Task DV4/04)<br />
CuCrZr alloy is one of most suitable materials for heatsinks in the ITER plasmafacing<br />
components (PFCs). The main problem of the alloy is that its thermal and<br />
mechanical properties degrade as soon as 450°C is exceeded, e.g., during the<br />
component manufacturing process or during operation in off-normal conditions.<br />
A parametric study of the degradation was carried out to define the safe working<br />
limits of CuCrZr and to choose the best thermal cycle for the component<br />
manufacturing. The specific aim was to envisage the temperature and the influence<br />
of the thermal treatment time on the mechanical and thermal properties of this ITER<br />
grade alloy.<br />
Hence, CuCrZr, in the solution annealing/water quench condition, was subjected to<br />
different heat treatments at temperatures of 475, 500, 550, 600 and 700°C and hold<br />
times of 5, 10, 20, 30, 40, 60, 120, 180, 240, 300 and 360 min. The reference ageing<br />
treatment for CuCrZr is 3 h at 475°C, which corresponds to a hardness of 130 HV.<br />
This is lower than the HV (159) of the as-received condition, due to the cold work<br />
effect. Assuming a minimum acceptable value of 100 HV for the mechanical strength<br />
of CuCrZr (which should guarantee a tensile strength in excess of 300 MPa at room<br />
temperature), a hot isostatic pressing (HIP) temperature as high as 550°C would be<br />
acceptable.<br />
A previous study by the Joint Research Centre (JRC) Ispra, aimed at establishing the<br />
minimum cooling rate required by the annealing temperature, had demonstrated<br />
that successful ageing of CuCrZr can only be achieved if the cooling rate is at least 2<br />
K/s from 970 to 870°C, and after that, faster than 1 K/s. Analysis of the results<br />
showed that a HIP temperature of ~550ºC is probably the best compromise for a<br />
reliable manufacturing process.<br />
The results also confirmed that, starting from an ageing condition, a hold time of
66<br />
3. FUSION TECHNOLOGY<br />
3.2 First Wall and Divertor<br />
600°C leaves the mechanical properties at acceptable values, although better results<br />
can be expected from a manufacturing process that starts from an as-received<br />
condition, with the temperature kept below or equal to 650°C.<br />
3.2.2 Manufacturing of small-scale W monoblock mockups by hot<br />
radial pressing (ITER EFDA R&D Tasks)<br />
The aim of this activity is to develop an alternative technique for manufacturing the<br />
ITER PFCs, which have a monoblock geometry (i.e. the vertical target).<br />
The basic idea is to perform radial diffusion bonding between the cooling tube and<br />
the tungsten tile, with the process parameters such that degradation of the thermalmechanical<br />
properties remains limited.<br />
The feasibility of joining Cu//Cu and Cu//W by diffusion bonding was studied,<br />
and some small-scale W monoblock mockups were successfully manufactured by<br />
placing them inside a special stainless steel container that does not deform during<br />
HIP, and tested for thermal fatigue (20 MW/m 2 for 1000 cycles).<br />
Following the good results obtained in the tests, a canister was then designed to<br />
perform hot radial pressing (HRP) in a standard furnace in which only a section of<br />
the canister (fig. 3.1) is heated and just the internal tube is pressurised up to the<br />
bonding pressure. The main advantage of this technique compared to HIP is that<br />
neither a high temperature/pressure furnace nor machining of the sheath is<br />
required.<br />
A dummy component was first tested using the following process parameters:<br />
temperature 600°C and pressure 700 bar applied for 3 h. The tests confirmed the<br />
capability of the canister to withstand the load conditions required by HRP.<br />
3.2.3 Runaway electrons on ITER PFCs (EFDA Contract /00-520)<br />
In 2001, the assessment of the thermal effects of runaway electrons (RAEs) on the<br />
ITER-FEAT plasma-facing components was concluded [3.1, 3.2].<br />
The integrated, versatile, multi-particle Monte Carlo code FLUKA was used to get<br />
the energy deposited inside the PFCs by a 10- or 15-MeV RAE impinging on the firstwall<br />
structures with an incidence angle of 1°. The geometrical model is a 3-D layered<br />
structure divided into 24 unit regions centred on the cooling tubes. Starting from the<br />
plasma, the model consists of armour, heatsink, cooling tube and coolant. Constant<br />
conditions were assumed in the poloidal direction. Five different geometries were<br />
investigated: 1) primary first wall armoured with Be (with and w/o protecting<br />
carbon fibre composite (CFC) poloidal limiters); 2) two port limiter first-wall options;<br />
3) Be flat tile; 4) CFC monoblock; 5) divertor baffle first wall armoured with W. The<br />
deposited energy density, normalised to one electron, for the Be-armoured first wall,<br />
and a 10-MeV RAE is shown in figure 3.2.<br />
∅54<br />
∅26<br />
[3.1] G. Maddaluno, S.<br />
Rollet, G. Maruccia,<br />
Thermal effects of<br />
runaway electrons on<br />
ITER plasma facing<br />
components, EFDA<br />
Contract 00-520 - Final<br />
Report - September 2001<br />
[3.2] G. Maddaluno et al.,<br />
Energy deposition and<br />
thermal effects of<br />
runaway electrons in<br />
ITER-FEAT plasma<br />
facing components, in<br />
preparation<br />
115<br />
150<br />
Fig. 3.1 - Cross section of<br />
the canister.
3. FUSION TECHNOLOGY 67<br />
3.2 First Wall and Divertor<br />
5 mm<br />
Fig. 3.3 - Temperature distribution for RAE=10 MeV for 0.1s.<br />
Fig. 3.2 - Normalised<br />
energy density (GeV/cm 3 )<br />
deposited by 10-MeV<br />
RAE.<br />
On the basis of the FLUKA outputs, the temperature pattern inside<br />
the first-wall structures was defined with the use of the finiteelement<br />
heat-conduction code ANSYS. The RAE energy deposition<br />
density was assumed to be 50 MJ/m2, and both 10- and 100-µs<br />
deposition times were considered. The temperature pattern just after<br />
the RAE energy deposition, for an electron energy of 10 MeV and<br />
energy deposition time of 0.1 s, is shown in figure 3.3 for geometry<br />
1). The amount of armour material exceeding the melting<br />
temperature is shaded grey in the figure.<br />
The analysis demonstrated that for all the options but the Be flat-tile port limiter, the<br />
heatsink and the cooling tube beneath the armour are well protected for both the<br />
RAE energies and both the energy deposition times. However, there is a high degree<br />
of melting (ablation) of the W (Be) surface layers, which would eventually affect the<br />
PFC lifetime. As for the primary first wall with CFC poloidal limiters, the limiters<br />
suffer severe ablation, the heat loads being six times larger than those in toroidally<br />
uniform structures. As much as 15 mm of carbon per pulse is removed from the<br />
limiter heads.<br />
3.3 Vacuum Vessel and Shield<br />
3.3.<strong>1.</strong> EM analyses of in-vessel components for ITER-FEAT<br />
[3.3] EFDA Contract 00-<br />
544, Design of the plasma<br />
facing component (PFC)<br />
for the divertor of ITER-<br />
FEAT (2000)<br />
[3.4] EFDA Contract 00-<br />
570, EM analyses of<br />
shielding blanket for<br />
ITER-FEAT design<br />
options, during plasma<br />
disruptions (2000)<br />
In ITER, the electro<strong>magnetic</strong> (EM) loads driven by plasma disruptions are one of the<br />
most problematic issues for the in-vessel engineering. Considerable effort has been<br />
spent on design analysis and R&D to obtain in-vessel components capable of<br />
withstanding the EM loads induced by plasma disruptions. During 2001, extensive,<br />
very detailed EM analyses were performed in support of this issue. For the support<br />
to be really effective, the analyses had to have competing objectives: very accurate<br />
component modelling, precision in describing the EM transient and, due to the very<br />
large number of cases to be treated, very short computing time. The objectives were<br />
achieved with the use of the zooming procedure developed at <strong>ENEA</strong>, which made it<br />
possible to run the number of cases needed to select, for each component, the design<br />
option with the best performance [3.3, 3.4].<br />
The EM loads induced by the ITER reference plasma disruptions were evaluated for<br />
the following in-vessel components: divertor, ICRH assembly, equatorial port limiter
68<br />
3. FUSION TECHNOLOGY<br />
3.3 Vacuum Vessel and Shield<br />
a)<br />
10<br />
<strong>1.</strong>8<br />
I(MA) corrected<br />
<strong>1.</strong>3<br />
uncorrected<br />
c)<br />
0.9<br />
R(m) correcteduncorrected<br />
0.4<br />
Z(m) corrected uncorrected<br />
0.0<br />
-0.5 10-2<br />
0.0 <strong>1.</strong>3 2.6 3.8 5.1 6.4<br />
b)<br />
Moments (MNm)<br />
<strong>1.</strong>5<br />
<strong>1.</strong>0<br />
5.0<br />
+<br />
0.0<br />
0.88<br />
-5.0<br />
Mr corrected VDE<br />
My corrected VDE<br />
Mr original VDE<br />
My original VDE<br />
+<br />
+ + + +<br />
+<br />
+<br />
+<br />
+<br />
0.39 0.4 0.41<br />
+<br />
0.42+<br />
0.43 0.44 0.45 0.46<br />
+<br />
+<br />
+<br />
d)<br />
-<strong>1.</strong>0<br />
Time (s)<br />
Fig. 3.4 - FEM electro<strong>magnetic</strong> model of ITER<br />
shielding blanket module.<br />
assembly and shielding blanket modules. The aim was to get a precise assessment of<br />
the loads and to investigate the effectiveness of the geometrical features of the<br />
components in reducing them. The most critical in-vessel components were<br />
indicated, and some design variants compatible with the main design philosophy<br />
were suggested in order to reduce the loads. The input excitations from simulations<br />
performed with time evolving MHD equilibrium codes were critically examined. It<br />
was demonstrated that the behaviour of the very last phase of the current quench<br />
could be numerical in origin. Accordingly, in agreement with most of the<br />
experimental evidence from the main operational tokamaks, a modification of the<br />
last current quench phase was suggested. Figure 3.4 shows the finite-element<br />
method (FEM) model developed for shielding-blanket module #1, together with the<br />
plot vs. time of the main EM loads on the component. The significant effect of the<br />
modification, in spite of the very small correction to the input excitation, is clear from<br />
the figure. The ITER Co-ordination Technical Activity (CTA) team agreed to consider<br />
the correction, as it could lead to a more realistic estimate of the loads.<br />
3.3.2 ITER-FEAT breeding blanket<br />
A water-cooled breeding blanket with both breeder and multiplier in the form of<br />
single-sized pebble beds was studied for ITER-FEAT (see fig. 3.5). Analyses showed<br />
that the proposed solution is capable of keeping the minimum breeder temperature<br />
at a sufficient level to enable continuous removal of the generated tritium, while the<br />
maximum temperature in the multiplier (beryllium) does not lead to dangerous<br />
chemical reactions with the water. Figure 3.6 reports the temperature distribution in<br />
the module. A sensitivity analysis was performed to evaluate how the variation in<br />
thermal conductivity of the multiplier affected the temperature distribution.
3. FUSION TECHNOLOGY 69<br />
450<br />
3.3 Vacuum Vessel and Shield<br />
120<br />
60<br />
O30 /<br />
O19 /<br />
O10 /<br />
15<br />
20<br />
150<br />
Support plate<br />
90<br />
150<br />
200<br />
30<br />
Column 2<br />
Column 1<br />
850<br />
Cooling plates<br />
(Thickness 5 mm)<br />
First wall<br />
Fig. 3.5 - Arrangement of<br />
ITER-FEAT blanket module.<br />
230<br />
30<br />
Fig. 3.6 - Blanket module:<br />
general temperature distribution<br />
from theoretical<br />
conductivity of the beryllium<br />
pebble bed.<br />
[3.5] T. KATO et al., First test results for the ITER<br />
central solenoid model coil, presented at the 21st Symp.<br />
on Fusion Technology SOFT (Madrid 2000)<br />
[3.6] Y. TAKAHASHI et al., Cryogenic Eng. 35, 7, 357<br />
(2000)<br />
[3.7] N. MARTOVETSKY et al., CSMC and CS insert test<br />
results, presented at the 2000 Appl. Superconductivity<br />
Conf. ASC (Virginia Beach 2000)<br />
[3.8] N. MARTOVETSKY et al., First results on ITER CS<br />
model coil and CS insert, presented at the 14th ANS<br />
Topical Meeting on the Technology of Fusion Energy<br />
(Park City 2000)<br />
[3.9] H. TSUJI et al., Progress of the ITER central<br />
solenoid model coil program, presented at the 18th IAEA<br />
Fusion Energy Conf. (Sorrento 2000)<br />
[3.10] N. Martovetsky et al., Test of the ITER central<br />
solenoid model coil, CS insert and TF insert, I.P. at the<br />
17thInt. Conf. on Magnet Technology (Geneva 2001)<br />
[3.11] T. Ando et al., Pulsed operation test results in the<br />
ITER-CS model coil and CS insert, presented at the 17th<br />
Int. Conf. on Magnet Technology (Geneva 2001)<br />
[3.12] E.P. Balsamo et al., Physica C 310, 258 (1998)<br />
3.4 Magnets<br />
3.4.1 Installation and testing of ITER CS<br />
and TF model coils (ITER Task M20)<br />
The central solenoid model coil (CSMC) was<br />
extensively tested in static and pulsed regimes in the<br />
first half of 2000. All the main goals of the testing<br />
program were achieved and the results presented at<br />
the major conferences [3.5-3.11].<br />
The coil then became a large testing facility in which<br />
samples of different types of conductors (40 – 90 m<br />
long) have already been tested (CS insert in 2000,<br />
toroidal field (TF) insert in 2001) or will be tested<br />
(Nb-Al insert in 2002, poloidal field (PF) insert in<br />
2003) in static or variable fields (up to 13 T).<br />
The main contribution of <strong>ENEA</strong> to data analysis<br />
concerned the study of AC losses, particularly a<br />
quantitative determination of the continuous<br />
decrease in the coupling losses in the conductor<br />
during the test campaign. This phenomenon had<br />
already been observed during the tests of an ITERrelevant<br />
coil at the <strong>ENEA</strong> laboratories [3.12].<br />
The toroidal field model coil (TFMC) (fig. 3.7) was<br />
installed in the TOSKA facility at
70<br />
3. FUSION TECHNOLOGY<br />
3.4 Magnets<br />
Fig. 3.7 - ITER toroidal field model coil prior to installation<br />
in the TOSKA facility at FZK.<br />
Forschungszeuntrum Karlsruhe (FZK) Germany in the first<br />
half of 2001 [3.13, 3.14], and a first phase of tests (coil alone)<br />
was carried out during the summer [3.15]. The rated current of<br />
80 kA was successfully achieved; this is the highest current<br />
level to date for a large superconducting magnet. All the other<br />
measured parameters (e.g., joint resistance, current sharing<br />
temperature, stress level, coil deformation, thermal-hydraulic<br />
behaviour) were in fair agreement with the predicted values.<br />
These results represent important milestones on the way to the<br />
construction of the ITER reactor, as they demonstrate that<br />
large high-field superconducting magnets with predictable<br />
properties can be designed and constructed.<br />
The Turin Polytechnic (POLITO) participated in these tasks<br />
under an ITER-EFDA contract: The M&M code was used to<br />
complete the development [3.16] of a multi-step heating<br />
strategy for Tcs measurements on the TFMC, without the<br />
Large Coil Test [3.17]. Five Tcs tests were performed at 80 kA,<br />
one at 69 and two at 57, all ending with a quench and safe<br />
dump of the coil current. The pressure drop in the heated<br />
TFMC pancakes was analysed [3.18]. POLITO also performed<br />
extensive analyses of and validation against data with the<br />
MITHRANDIR code [3.19-3.22], contributed to the first steps<br />
[[3.23, 3.24] in developing the THELMA code (coupled<br />
thermal-hydraulic and EM description of a superconducting<br />
cable-in conduit conductor) and, finally, participated in the<br />
TFCI test campaign.<br />
[3.13] R.K. Maix et al. Fusion Eng. Des. 58-59,<br />
159 (2001)<br />
[3.14] A. Ulbricht el al., Assembly in the test<br />
facility, acceptance tests and first test<br />
results of the ITER TF model coil, presented<br />
at the 17th Int. Conf. on Magnet Technology<br />
(Geneva 2001)<br />
[3.15] D. Ciazynsky et al., Resistances of<br />
electrical joints in the TF model coil of ITER,<br />
presented at the 17th Int. Conf. on Magnet<br />
Technology (Geneva 2001)<br />
[3.16] L. Savoldi and R. Zanino, Extended<br />
analysis of Tsc tests in DP<strong>1.</strong>2 using M&M,<br />
presented at the 13th TFMC Test and Analysis<br />
Meeting (Karlsruhe 2001)<br />
[3.17] L. Savoldi et al., First measurement of<br />
the current sharing temperature at 80 kA in<br />
the ITER toroidal field model coil (TFMC),<br />
presented at the 17th Int. Conf. on Magnet<br />
Technology (Geneva 2001)<br />
[3.18] R. Zanino and L. Savoldi, Pressure drop<br />
analysis in DP1 @ 4 K, presented at the15th<br />
TFMC Test and Analysis Meeting (Cadarache<br />
2001)<br />
[3.19] K. Hamada et al., Experimental results<br />
of pressure drop measurements in ITER CS<br />
model coil tests, presented at CEC (2001), to<br />
appear in Adv. Cryo. Eng.<br />
[3.20] R. Zanino et al., Pressure drop analysis<br />
in the CS insert coil, presented at the<br />
Cryogenic Engineering Conf. (Madison 2001)<br />
[3.21] R . Zanino et al., Inductively driven<br />
transients in the CS insert coil (I): heater<br />
calibration and conductor stability tests and<br />
analysis, presented at the Cryogenic<br />
Engineering Conf. (Madison 2001)<br />
[3.22] L. Savoldi, E. Salpietro and R. Zanino,<br />
Inductively driven transients in the CS insert<br />
coil (II): quench tests and analysis, presented<br />
at the Cryogenic Engineering Conf. (Madison<br />
2001)<br />
[3.23] L. Savoldi and R. Zanino, Thermalhydraulic<br />
module for the THELMA code,<br />
presented at the Meeting on the Development<br />
of Tools for the Analysis of AC current<br />
Distribution in Superconducting Magnets<br />
(Garching 2001)<br />
[3.24] R. Zanino, L. Savoldi, P.L. Ribani,<br />
Preliminary results on coupling between TH<br />
and EM (conductor) modules for THELMA<br />
code, presented at the Meeting on the<br />
Development of Tools for the Analysis of AC<br />
Current Distribution in Superconducting<br />
Magnets (Frascati 2001)
3. FUSION TECHNOLOGY 71<br />
3.4.2 Development of calculation codes for CIC conductors (EFDA<br />
Task TWO-T400-1/01)<br />
The development of a new calculation code, started in 2000, continued in 200<strong>1.</strong> The<br />
code includes all the macroscopically relevant physical phenomena characterising a<br />
forced flow cooled cable-in-conduit (CIC) conductor and is being developed by<br />
various universities co-ordinated by <strong>ENEA</strong>. The code is structured as a set of four<br />
separate software modules, each describing one conductor characteristic.<br />
The modules deal with the EM and thermal-hydraulic behaviour of the conductor,<br />
the EM behaviour of the joints and the mechanical behaviour of the cable. During<br />
2001, all these modules were fully developed and the first tests started. The EM<br />
section was first tested vs. the current distribution code (CUDI) developed by the<br />
University of Twente. (This code is a simplified tool applied in the case of a short<br />
single-stage cable.) Using 36 ad-hoc-fabricated insulated Cu wires cabled as 3x3x4, a<br />
second code test was performed. The self- and mutual inductances of the conductor<br />
were measured and compared successfully with those calculated by the code. Finally,<br />
the code was used to calculate the expected value of the self- and mutual inductance<br />
for a group of strands of the <strong>ENEA</strong> Stability Experiment Upgrade (SExUp) .<br />
The thermal-hydraulic module was successfully tested vs. the already validated<br />
MITHRANDIR code. Finally, the two electro<strong>magnetic</strong> and the thermal-hydraulic<br />
sections were coupled together to check the coupling effectiveness.<br />
The final tests of the results from the <strong>ENEA</strong> SEx are planned for 2002.<br />
3.4 Magnets<br />
3.4.3 New diagnostics for a CIC conductor (EFDA Task TWO-T400-<br />
1/01)<br />
The helium temperature in a CIC conductor is usually measured by means of<br />
resistance sensors glued or soldered onto the external part of the conductor jacket.<br />
This arrangement gives an indirect measurement of the helium temperature, a delay<br />
in the temporal response during fast transients and a very light EM neutrality that<br />
seriously affects the measurement accuracy. One way of overcoming these problems<br />
is to use optical measurements, which can give fast, highly accurate, noise and<br />
<strong>magnetic</strong>-field-insensitive helium temperature measurements.<br />
This new approach is based on an optical fibre with Bragg gratings that can be photoimprinted<br />
into the fibre. By illuminating the fibre with a broadband source of light,<br />
a narrow band is reflected at the Bragg wavelength. Its dependence on temperature<br />
comes from two effects: the index of refraction and the thermal expansion of glass.<br />
The local temperature at different positions can be measured by imprinting along the<br />
fibre various gratings with different pitches. In the cryogenic temperature range, the<br />
heat expansion coefficient is not monotonous [3.25], and the feasibility of the<br />
measurement still has to be demonstrated. Moreover, a strain effect competes with<br />
the thermal effect by increasing the fibre length, although temperature/strain<br />
discrimination has recently been successfully achieved [3.26].<br />
[3.25] G. H. White et al.,<br />
Phys. Chem. Glasses 6, 3<br />
(1965)<br />
[3.26] M.G. Xu et al.,<br />
Electron. Lett. 30, 1085<br />
(1994)<br />
A cryogenic system was realised to test the optical fibre temperature measurements<br />
by comparing them with measurements from a traditional sensor. Three different<br />
fibres were tested (fig. 3.8): uncoated fibre (i.e., fibre whose external acrylate<br />
protection coating has been removed) in order to have a reference value for the bare<br />
fibre; fibre with its own acrylate coating; fibre whose acrylate coating has been<br />
removed and the sensor coated with zinc by plunging the fibre into liquid Zn. As<br />
shown in figure 3.8, the Zn-coated fibre shows a much larger heat expansion<br />
coefficient than the others.
72<br />
3. FUSION TECHNOLOGY<br />
3.4 Magnets<br />
Wavelength shift (nm)<br />
0<br />
-2<br />
-4<br />
-6<br />
-8<br />
uncoated fibre<br />
acrylate coated fibre<br />
Zn coated fibre<br />
100 200 300 400 500 600<br />
Time (s)<br />
Fig. 3.8 - Optical fibre<br />
temperature measurement.<br />
3.4.4 Development of NbTi conductors for ITER PF coils (ITER<br />
Task M50, EFDA Task TWO-T405/1 and TW1-TMC/SCABLE)<br />
The joint R&D activity with CEA Cadarache on NbTi conductors for ITER continued<br />
successfully. In accordance with the programme, two 108-strand cables made from<br />
Alstom and Europa Metalli NbTi strands were jacketed by Europa Metalli and used<br />
by CEA to manufacture two NbTi subsize joint samples (SSJS), under testing at the<br />
JOSEFA facility, Cadarache.<br />
A long subsize 36-strand (Ni-coated NbTi EM strands) CIC conductor manufactured<br />
at Europa Metalli achieved a void fraction of 36.8%. To ascertain the role of the void<br />
fraction in the coupling loss time constant (nτ), three additional short samples with<br />
void fractions down to 31% were manufactured from the initial conductor. The nτ of<br />
the samples was measured at the University of Twente, and the results showed that<br />
the Ni coating makes the coupling loss time constant, i.e., the transverse resistivity of<br />
the cable, rather insensitive to variations in the void fraction in the explored range.<br />
A total conductor length of 120 m was delivered to the winding company, Ansaldo<br />
CRIS, to manufacture the SExUp test magnet.<br />
Characterisation of Europa Metalli NbTi strand<br />
As already mentioned, two types of basic NbTi strands are used for the subsize and<br />
full-size conductor samples to be tested at the Sultan facility: an internal Cu-Ni<br />
barrier strand without any external coating, manufactured by Alstom, and a Nicoated<br />
strand manufactured by Europa Metalli.<br />
Complete electrical characterisation of the two strands was performed at the <strong>ENEA</strong>,<br />
CEA and Twente University laboratories. The critical currents, AC losses and critical<br />
temperatures of the EM strands were measured at <strong>ENEA</strong>. The strand characteristics<br />
are reported in table 3.I.<br />
Direct transport critical current measurements were<br />
performed on a 1-m-long wire sample wound on a 43-mmdiam<br />
Ti-Al-V sample holder, at liquid helium temperature,<br />
with a transversal external field in the range 2-8 T. Critical<br />
current values were determined by the “10 µV/m Electric<br />
Field” criterion on a 20-cm voltage tap distance.<br />
Magnetisation measurements were done on a 6-mm-diam<br />
open-turn sample (9.87 mm 3 volume). The data were<br />
obtained by a vibrating sample magnetometer system at<br />
different temperatures (4.2, 5.0, 5.7 and 6.5 K), with<br />
Table 3.I - Main characteristics of the EM<br />
NbTi strand<br />
Diameter<br />
0.81mm<br />
Cu:non-Cu <strong>1.</strong>9<br />
Twist pitch<br />
8mm<br />
N° of filaments 6534<br />
Average filament diameter<br />
6mm<br />
Thickness of Ni coating<br />
1mm<br />
Guaranteed critical current at 6 T, 4.2 K > 380A
3. FUSION TECHNOLOGY 73<br />
3.4 Magnets<br />
Fig. 3.9 - NbTi critical<br />
current curves I c (B,T).<br />
Ic(A)<br />
1200<br />
1000<br />
800<br />
600<br />
400<br />
200<br />
T = 4.2K<br />
Ic fit TWENTE<br />
Ic TWENTE<br />
Ic magn<br />
Ic <strong>ENEA</strong><br />
Ic fit CEA<br />
0<br />
1 2 3 4 5 6 7 8 9<br />
B(T)<br />
<strong>magnetic</strong> fields up to 10 T. The<br />
system was periodically<br />
calibrated using a nickel<br />
sample with the same NbTi<br />
strand shape. Magnetisation<br />
cycles not only provide a<br />
measurement of AC losses<br />
during external <strong>magnetic</strong> field<br />
cycles but also allow<br />
determination of the critical<br />
current; the critical current<br />
density J c (B,T) is related to the<br />
magnetisation cycle amplitude<br />
∆M(T,B).<br />
A basic difference between<br />
transport and magnetisation Jc<br />
measurement lies in the<br />
presence of the transport current, which modifies the field penetrating the sample.<br />
For comparison purposes, I c (T,B ext ) data have, therefore, to be referred to an<br />
external applied field.<br />
Critical temperatures were determined by the “half-of-full resistance” criterion of the<br />
resistive transition, at 0 and 5 T, using a 3-cm-long wire sample. A 50-mA current was<br />
applied, which resulted in very sharp transitions.<br />
The transport I c (B) data measured on the same strand by Twente University and<br />
CEA were compared with data obtained by <strong>ENEA</strong>. Figure 3.9 shows the NbTi critical<br />
current curves I c (B,T) of CEA and Twente, together with <strong>ENEA</strong>’s experimental I c<br />
data for both magnetisation and transport measurements. The agreement is quite<br />
good in the field range from 4 to 8 T, while at very low field, the magnetisation Ic are<br />
larger than those from the transport measurement.<br />
Configuration and experimental programme of <strong>ENEA</strong> SExUp<br />
One of the most interesting results obtained during the testing of the ITER model<br />
coils was that the slope of the critical current curve of the CIC conductor seemed to<br />
be reduced compared with that of the single Nb 3 Sn strands. Two different<br />
hypotheses have been proposed: the first takes into account a possible uneven<br />
current distribution across the cable; the second starts from possible damage caused<br />
to the strand by Lorentz forces.<br />
A NbTi superconducting magnet is scheduled to be tested in conditions as close as<br />
possible to those foreseen for the ITER poloidal field coils. To investigate the effect of<br />
uneven current distribution on CIC conductors, an innovative electrical joint was<br />
added to this magnet. This configuration will make it possible to force a controllable,<br />
measurable, uneven current distribution in the conductor and to evaluate the effect<br />
of the current distribution on the magnet. A new set of very accurate flow meters will<br />
be used to evaluate the helium flow during fast transients and its effect on stability.<br />
[3.27] P. Bellucci et al.,<br />
Stability dependence on<br />
flow in a CICC, to be<br />
published in Physica C<br />
Dedicated voltage taps will be used to measure inter-strand resistivity as a function<br />
of the number of charge/discharge cycles.<br />
Interpretation of SExUp results<br />
Analysis of the stability-experiment data addressed two main topics: magnet<br />
stability dependence vs. helium flow [3.27] and AC loss evaluation.
74<br />
3. FUSION TECHNOLOGY<br />
3.4 Magnets<br />
The first topic is mainly interesting for code validation. What is modelled in thermohydraulic<br />
codes is a transition in cooling regime, the so-called well-cooled regime to<br />
ill-cooled regime. Such a change should depend on flow speed and physically<br />
corresponds to situations where, during a heat generation transient caused, for<br />
example, by an EM external disturbance, all the cooling reservoir contained in the<br />
helium can or cannot be absorbed by the strands. If the heat exchange is effective,<br />
then there should be no dependence of the stability on helium speed.<br />
In measuring the stability, no dependence on the helium flow was found, but the<br />
results obtained from the simulation code were different. This means that probably<br />
the transition zone between well/ill-cooled regimes is not well described in the code.<br />
Due to the difficulties in measuring the helium flow, no final quantitative conclusion<br />
can be drawn, but since the experiment is reproducible, other data can be acquired<br />
to solve the uncertainties.<br />
3.4.5 Test in SULTAN of the <strong>ENEA</strong> Nb 3<br />
Sn magnet (ITER Task M20)<br />
The <strong>ENEA</strong> 12-T CIC conductor Nb 3 Sn magnet was dismounted from the Pulsed<br />
Field Facility (PuFF) at <strong>ENEA</strong> Frascati and modified and assembled in the<br />
configuration for testing in the SULTAN facility at CCRP Villigen, Switzerland. The<br />
magnet is now ready to be shipped as soon as the final test schedule is fixed.<br />
3.4.6 Chemical deposition of oxide buffer layers for YBCO-coated<br />
metallic tapes<br />
The Sol-Gel approach was used to deposit buffer layers of Ca,Gd, Y oxides on<br />
textured metallic substrates. The buffer layers have the double role of avoiding Ni<br />
contamination of the YBCO film and inducing its growth in a well-textured structure.<br />
The Sol-Gel approach is attractive as it is scalable to long-length industrial<br />
manufacture.<br />
After extensive development activities, the appropriate parameters for the chemical<br />
deposition of the oxides were defined.<br />
3.4.7 Development of Nb 3<br />
Al strands for high-field applications<br />
Nb 3 Al strands in a Nb matrix have been found to have significant critical<br />
current density at high fields (B>15T). Their good performance is linked to the<br />
formation of stoichiometric Nb3Al A-15 compound, achievable with the so-called<br />
rapid-heating-quenching technique. A strand formed of a Nb matrix with embedded<br />
Nb-Al unreacted filaments is heated up to 2000°C and then rapidly quenched<br />
below 50°C.<br />
A preliminary prototype of a rapid-heating-quenching apparatus was built and<br />
tested. The experience gained will be used to design an updated version of the<br />
system.<br />
The relevant literature was investigated to check the progress in the experimental<br />
data relative to improving the Nb 3 Al transport properties by addition of a third<br />
element.<br />
The technology implemented for chemical deposition of the buffer layers was<br />
successful and produced layers with good microstructural properties, rugosity and<br />
compactness. The next step will be to develop chemical deposition of YBCO thick<br />
films on top of the metallic-tape + buffer-layer structure.
3. FUSION TECHNOLOGY 75<br />
3.4 Magnets<br />
3.4.8 Feasibility study on eddy current testing of ITER coil case<br />
welds (ITER Task TW1-TMS/MMTFRD)<br />
The feasibility study carried out through experimental tests was successfully<br />
concluded. All the tests were performed in laboratory conditions on a series of<br />
samples containing artificial and natural faults. Eddy current techniques were<br />
successfully used to inspect tungsten inert gas (TIG) and submerged arc multipass<br />
welding (SAW) on thick austenitic 316 LN. The VR-11 probe developed by <strong>ENEA</strong><br />
showed very high sensitivity compared to other commercial probes. Probe angle<br />
configurations of 45° and 90° for lateral and central defects, respectively, were<br />
assessed. Working frequencies of 15, 30 and 60 KHz were identified to better<br />
distinguish between superficial and sub-superficial defects. Defects such as voids<br />
and collages with only a few mm of extension can be detected with a good<br />
probability.<br />
With these results it was possible to specify the requirements for operating in field<br />
conditions: probe frequency and data processing (fig. 3.10). Hence, the requirement<br />
now is to validate passing from a prototype<br />
system to an industrial testing system.<br />
C2C30<br />
30 kHz<br />
In conclusion, the ITER coil case multipass<br />
welding can now be inspected with the<br />
eddy current technique proposed and<br />
developed by <strong>ENEA</strong>. This technique is<br />
easier, faster, less expensive and more<br />
reliable than any other nondestructive<br />
testing techniques. Moreover, at the<br />
moment, it seems to be the only applicable<br />
technique for thick-cast stainless-steel<br />
multipass welds.<br />
B/E-C frontal image<br />
Fig. 3.10 - Reference block: central line (lateral passes<br />
overlapping) inspection by VR-11 probe at 90°, lift-off 4 mm.<br />
The most important target (the feasibility)<br />
has been reach-ed, and the final goal (ITER<br />
coil case real test) can be reached, too,<br />
through subsequent engineering efforts.<br />
[3.28] H. Iida, V.<br />
Khripunov, L. Petrizzi,<br />
Nuclear Analysis Report,<br />
Nuclear Analysis Group,<br />
ITER Garching JWS,<br />
ITER report G73 DDD 01-<br />
06-06 (2001)<br />
[3.29] H. Iida et al.<br />
“Nuclear Analysis of<br />
ITER-FEAT” in preparation<br />
[3.30] MCNP 4B, Monte<br />
Carlo N-Particle Transport<br />
System, Los Alamos<br />
National Laboratory Ed.<br />
by J. Briesmeister, LA-<br />
12625-M, (1993)<br />
3.5.1 3-D nuclear analysis for ITER-FEAT design<br />
3.5 Neutronics<br />
<strong>ENEA</strong> was strongly involved in the neutronics analysis for the ITER-FEAT (500-MW<br />
fusion power) through support to the Nuclear Analysis Group (NAG) of the Joint<br />
Central Team (JCT) in the nuclear analysis itself and in editing the NAG final report<br />
[3.28, 3.29]. A fairly sophisticated nuclear analysis was performed by means of the<br />
best-assessed nuclear data and codes and the most detailed models. A new 3-D basic<br />
model for MCNP [3.30] was constructed according to a shared effort between the JCT<br />
and the Home Teams (HT) of the ITER-EDA. The basic model is a 20° toroidal sector<br />
with proper boundary conditions at both sides (fig. 3.11). The model includes<br />
analysis of a) global and local nuclear heating for the design of each component; b)<br />
global and local shielding optimisation for hands-on maintenance; c) radiation<br />
conditions in materials sensitive to irradiation; d) activation of materials including<br />
the cooling water.<br />
Among the above nuclear responses, nuclear heating in the toroidal field coil (TFC)<br />
inboard legs required very high accuracy, even at a very early stage of design
76<br />
3. FUSION TECHNOLOGY<br />
3.5 Neutronics<br />
modification. The design limit of nuclear heating in the superconducting magnets is<br />
~14 kW. The heating of the inboard legs has become a major contributor (~ 80%) in<br />
the new machine, and detailed calculations<br />
have shown that it can reach 24 kW if<br />
uncertainties in the nuclear data (the Fusion<br />
Evaluated Nuclear Data Libraries FENDL<br />
[3.31]) and tools are considered. This is a<br />
concern to be tackled by the designers. If the<br />
limit has to be observed, additional shielding<br />
(5-10 cm) will be required in the inboard part<br />
of the machine. However, apart from the<br />
heating on the magnet system, another issue<br />
of equal relevance in the ITER design is the<br />
dose rate outside the machine and around the<br />
cryostat after shutdown. The dose-rate value<br />
decides how long personnel have to wait<br />
before accessing areas of the reactor for<br />
repair/maintenance. The assigned limits are<br />
100 µSv/hr in the cryostat, 12 days after<br />
shutdown, and 10 µSv/hr in the bioshield, 1<br />
day after shutdown. Dose-rate levels can be<br />
derived with a simple 1-D model, and<br />
adequate shielding can be provided, but<br />
penetrations and ports bias the expected<br />
attenuation. A novel method to calculate the<br />
dose rate in ITER was proposed and applied<br />
[3.32]. It is a flexible tool for treating decay<br />
gamma transport in complex geometries and<br />
was extensively used to analyse the shielding<br />
problems related to the three major port<br />
penetrations. Local shielding solutions were<br />
proposed to keep the dose rate in the cryostat<br />
below the assigned limit.<br />
Fig. 3.11 - Poloidal section<br />
of the 3-D ITER basic<br />
model.<br />
[3.31] H. Wienke, M.<br />
Herman, FENDL/MG-2.0<br />
and FENDL/MC-2.0 the<br />
processed cross-section<br />
libraries for neutron<br />
photon transport calculations,<br />
Report IAEA-NSD-<br />
176, Rev. 1 (Vienna 1998)<br />
[3.32] L. Petrizzi et al.,<br />
Advanced Methodology<br />
For Dose Rate Calculation<br />
of ITER-FEAT in preparation<br />
A complete nuclear analysis of the divertor components, high heat flux component<br />
and the cassette was also performed. A map of the nuclear heating was calculated for<br />
the thermal analyses. The maximum power density on the upper tungsten coating<br />
ranges between 4-12 W/cm 3 . The overall nuclear heating on the component is about<br />
58 MW. Special response functions were calculated for some critical issues, such as<br />
reweldability of the manifolds, which are affected by helium production. Helium<br />
production ranges between 0.35-7 appm for the fluence (0.3 MWy/m 2 ) foreseen for<br />
ITER. The reweldability limit is about 3 appm for thin plate/tube welding and 1<br />
appm for thick plate/tube welding. The present design incorporates the cassette<br />
replacement scheme, so that the above reweldability limits are never exceeded. A<br />
shielding analysis was done to check that the cassette reference design provides<br />
sufficient shielding. Nuclear heating was calculated in a limited poloidal extension<br />
of the TFC. (Just the part behind the divertor was described.) The nuclear power<br />
deposited in the TFC is 380 W for the 18 coils. The model assumed closed ports in the<br />
divertor regions, so streaming through them was not considered.<br />
3.5.2 Experimental validation of shutdown dose rates for ITER<br />
A shutdown dose-rate experiment was performed at the Frascati Neutron Generator<br />
(FNG). The material assembly used was suitable for generating a neutron flux<br />
spectrum similar to that expected for the outer vacuum vessel region of ITER. The
3. FUSION TECHNOLOGY 77<br />
3.5 Neutronics<br />
Fig. 3.12 - Measured dose<br />
rate in the cavity centre.<br />
[3.33] P. Batistoni et al.,<br />
Experimental validation<br />
of shutdown dose rate<br />
experiment. Final report<br />
of ITER Task T-426,<br />
FUS-TN-SB-NE-R-002<br />
(2001)<br />
[3.34] P. Batistoni et al.,<br />
Fusion Eng. Des. 58-59,<br />
613 (2001)<br />
[3.35] P. Batistoni et al.,<br />
Benchmark experiment<br />
for the validation of shut<br />
down activation and dose<br />
calculation in a fusion<br />
device, presented at the<br />
Int. Conf. on Nuclear<br />
data for Science and<br />
Technology (ND2001) and<br />
accepted for publication<br />
in J. Nucl. Sci. Technol.<br />
Sv/h<br />
10-3<br />
10-4<br />
10-5<br />
10-6<br />
Background inside the cavity<br />
Measured dose rate (G-M)<br />
Measured dose rate (TLD)<br />
Background dose rate in the cavity<br />
1 day 7 day 1 month<br />
10-7<br />
+ + +<br />
10-5 10-4 10-3 10-2 10-1 100<br />
Time after irradiation (years)<br />
assembly was irradiated<br />
long enough<br />
to create a sufficiently<br />
high level of activation<br />
for monitoring by<br />
dosimeters and other<br />
radiation detectors<br />
after shutdown. Provision<br />
was made for<br />
the cooling time<br />
assumed necessary<br />
before allowing<br />
personnel access. The<br />
objective of the<br />
experiment was to<br />
validate the present<br />
dose rate calculations in a typical and complex shield geometry. It was started in 2000<br />
and completed in 2001 in collaboration with the Technical University of Dresden<br />
(TUD) and Forschungszentrum of Karlsruhe (FZK).<br />
The mockup was irradiated with 14-MeV neutrons for three days at the FNG. The<br />
resulting dose rate was measured for about four months of cooling time by two<br />
independent experimental techniques (fig. 3.12). Other useful measurements, such as<br />
the neutron spectrum, decay gamma-ray spectrum, dose-rate distribution and some<br />
relevant activation reaction rates inside the mockup, were performed [3.33-3.35].<br />
The experiment was then analysed with a rigorous, two-step method (R2S), i.e.,<br />
using the neutron transport code MCNP-4C and the activation code FISPACT, and a<br />
direct, one-step method (D1S), approximate but more straightforward, with an ad<br />
hoc modified version of MCNP used in the nuclear analysis of ITER. The FENDL-2<br />
nuclear data libraries (FENDL/MC-2 for the neutron flux calculation and<br />
FENDL/A-2 for the activation calculation), which are the ITER reference libraries,<br />
were used for both methods. The European libraries EFF/EAF-2001 and the Japanese<br />
libraries JENDL-FF/JENDL-3.2(A) were used with R2S.<br />
The analysis showed that the dose rate measurement inside the mockup is well<br />
predicted by R2S and by all the nuclear data library packages: in the comparison in<br />
figure 3.13, all the computed vs. experimental (C/E) values are close to unity within<br />
the total uncertainty, with the exception of some under-estimations found at about 1<br />
day of decay time.<br />
Fig. 3.13 - C/E dose rate<br />
in the cavity centre.<br />
C/E<br />
<strong>1.</strong>6<br />
R2S/EFF/EAF2001<br />
<strong>1.</strong>4<br />
R2S/EEN-2<br />
R2S/JENDL<br />
D1S (FENDL-2/A)<br />
<strong>1.</strong>2<br />
<strong>1.</strong>0<br />
8 . 10-1<br />
6 . 10-1<br />
4 . 10-1<br />
10-4 10-3 10-2 10-1<br />
Time after irradiation (years)<br />
100<br />
The approximate<br />
D1S method with<br />
FENDL-2 is also<br />
in good agreement<br />
with<br />
measurements<br />
and gives values<br />
slightly but<br />
systematically<br />
lower than R2S.<br />
This may be due<br />
to the fact that<br />
minor nuclides,<br />
contributing to<br />
the total dose<br />
rate at the
78<br />
3. FUSION TECHNOLOGY<br />
3.5 Neutronics<br />
percent level, are not considered in D1S. It was concluded that the shutdown dose<br />
rate for the outer vessel region is well predicted within 25% by the R2S and D1S<br />
methods with the FENDL-2 library.<br />
3.5.3 Design of the neutron cameras for ITER<br />
ITER will have two neutron cameras for measuring the neutron emission distribution.<br />
This diagnostic system has to provide absolute neutron yield, fusion power, alphaparticle<br />
birth profile and ion temperature, besides the neutron source profile.<br />
The radial camera, located in a horizontal port, consists of a fan-shaped array of<br />
flight tubes (totalling 12×3 ) viewing the plasma through a slot at the blanket/shield<br />
level, intersecting at a common aperture (focal point) defined by a specialised<br />
shielding plug, and penetrating the vacuum vessel, cryostat and biological shield<br />
through stainless-steel windows. Each flight tube culminates in a set of neutron<br />
detectors (both flux detectors and compact spectrometers) housed in a massive<br />
shielded structure outside the biological shield. The geometry of the radial camera is<br />
fixed by the port size; as a result, the plasma fraction covered is rather limited. The<br />
vertical camera has a different configuration: the arrays of 15 chords viewing the<br />
plasma downward are located at four different toroidal locations. Each array of<br />
chords views the plasma through the first collimators in the upper radial port plug<br />
and through the second collimators above the upper cryostat lid. Flight tubes are<br />
placed in the vacuum vessel, above the plug of the upper radial port. The upper<br />
collimators, the detectors and beam dumps are located between the cryostat lid and<br />
the top bioshield and are housed in a massive shielded structure to prevent neutron<br />
scattering and to limit the cryostat activation to allowable levels.<br />
The measurement capability of the system was evaluated for relevant neutron source<br />
profiles [3.36]. In particular, the chord integrals of the neutron emissivity and the<br />
resulting fluxes at the detectors were calculated for both the radial and the vertical<br />
camera, for the reference operation scenario (ELMy H-mode) and for the more<br />
peaked neutron emissivity profiles. The results showed that the accuracy of the<br />
absolute value of total neutron yield measured by the radial camera alone would not<br />
be better than 20% due to the very limited plasma coverage. The combination of the<br />
radial and vertical cameras will increase the accuracy of the absolute neutron yield<br />
to better than 10%, as required. The minimum number of sightlines in the vertical<br />
camera and the effectiveness of the most external sightlines were analysed, taking<br />
into account the neutron backscattering from the first wall. As a result, it was found<br />
that the most external channels of the vertical camera are still effective (although<br />
considerable corrections have to be applied) in the case of the reference ELMy H-<br />
mode operation scenario, which is characterised by a very flat neutron emissivity<br />
profile. In the case of more peaked emissivity profiles, the most external channels<br />
and the ones adjacent to them lose their effectiveness and can cause a significant<br />
level of noise due to backscattering neutrons.<br />
[3.36] P. Batistoni,<br />
Design of the radial and<br />
vertical neutron camera<br />
for ITER, in preparation<br />
The size of the collimator diameters was optimised in the range of variation in the<br />
neutron production rate to improve the measurement capability. Flux monitors<br />
suitable for the ITER camera requirements were identified. As for compact<br />
spectrometers, a number of possible candidates exist; however, they require further<br />
investigation and development before they can meet the ITER requirements for<br />
energy and time resolution in neutron energy spectra measurements. <strong>ENEA</strong> is<br />
investigating the capability of organic liquid scintillators (NE213) to provide an<br />
effective energy resolution of about 2-3% at 2.45-MeV neutron energy and 1% at 14<br />
MeV in tokamak conditions, i.e., proving neutron/gamma-ray and pulse-height<br />
discrimination at high counting rates. In collaboration with PTB Braunschweig,<br />
Germany the feasibility of the method is being investigated, and the capability of the
3. FUSION TECHNOLOGY 79<br />
3.5 Neutronics<br />
system to reach useful energy resolution will be tested during D-D and D-T<br />
operations at JET.<br />
3.5.4 Evaluation of neutron cross sections for fusion materials (EFF<br />
project)<br />
The correct design of a fusion reactor requires the availability of a complete nuclear<br />
database extending up to 20 MeV in neutron energy. The <strong>ENEA</strong> Fusion and Applied<br />
Physics Divisions participated in the European Fusion File (EFF) Project by updating<br />
neutron cross-section data. In 2001, the carbon and oxygen cross sections were<br />
newly evaluated on the basis of the latest experimental and theoretical findings. The<br />
neutron capture cross sections were re-evaluated in the entire range of 10 -5 eV up to<br />
20 MeV of incident neutron energy. Model calculations based on state-of-the-art<br />
nuclear structure and nuclear reaction models were employed together with a global<br />
analysis of the latest experimental information. Inverse photo-neutron reaction data<br />
were utilised to cover the energy range above a few MeV. These data and the model<br />
calculations were used for the transitions leading to excited states of residual nuclei.<br />
The resulting nuclear cross-section data were compiled and organised into ENDF 6<br />
nuclear data format. The files were integrated with complete existing data libraries<br />
(including all the reaction channels other than capture). For 12 C, the JENDL 3.2 file<br />
was chosen as a basis; for 16O, the JEF-2 file was selected. The data files were made<br />
available to the community for testing. Preliminary tests were done with standard<br />
format checking codes (FIZCON, PSYCHE, and CHECKR).<br />
3.5.5 Neutronics benchmark experiment on SiC (EFF project)<br />
[3.37] P. Batistoni et al.,<br />
Measurements and<br />
analysis of reaction rates<br />
and of nuclear heating in<br />
SiC, Final report of task<br />
TTMN-002 (1)-001,<br />
Report FUS- TEC- MA-<br />
NE-R-2001<br />
Fig. 3.14 - The SiC block in<br />
front of the FNG target.<br />
Silicon carbide (SiC) is one of the candidate structural materials for a fusion reactor<br />
because it has excellent low-activation, low-decay-heat properties. To validate the<br />
SiC neutron cross-section data in the EFF library, a benchmark experiment was<br />
started in 2000 at FNG. A block of sintered SiC (457 mm x 457 mm, 711-mm thick, 470<br />
kg total weight, 127 pieces) lent to <strong>ENEA</strong> by JAERI was used (fig. 3.14). The<br />
experiment was completed in 2001 in collaboration with TUD, FZK and the Josef<br />
Stefan Institute of Ljubljana [3.37].<br />
Several nuclear quantities, including neutron and gamma-ray spectra, nuclear<br />
heating and activation rates, were measured at different penetration depths inside<br />
the block irradiated with 14-MeV neutrons (up to about 58 cm, corresponding to<br />
about 10 mean free paths for 14-MeV neutrons). The measurements were compared<br />
with the same quantities calculated using MCNP-4C and the deterministic 2-D code<br />
DORT with EFF-2.4, the new evaluated cross sections for Si-28 included in EFF-3.0,<br />
and the international FENDL-2 and Japanese JENDL-FF nuclear data libraries.<br />
Comparison shows that the<br />
European files and JENDL-<br />
FF well reproduce the<br />
measured quantities, within<br />
the total uncertainty, while<br />
FENDL-2 tends to<br />
significantly under-estimate<br />
the fast neutron flux, as<br />
shown in figure 3.15 where<br />
the C/E values are given for<br />
the neutron flux in the<br />
energy range E > 10 MeV.<br />
The experiment was also<br />
used to validate, through<br />
deterministic and Monte
80<br />
3. FUSION TECHNOLOGY<br />
3.5 Neutronics<br />
Carlo approaches, the numerical tools under development for sensitivity/uncertainty<br />
analysis. Through the<br />
<strong>1.</strong>3<br />
Nb-93(n,2n) (E<br />
analysis it was possible<br />
<strong>1.</strong>2<br />
n >10MeV)<br />
to find the reason for<br />
<strong>1.</strong>1<br />
the underestimation<br />
<strong>1.</strong>0<br />
(mainly the low value<br />
0.9<br />
of the inelastic cross<br />
0.8<br />
MCNP-EFF-2.4<br />
sections) in FENDL-2<br />
0.7<br />
MCNP-EFF-3.0<br />
DORT/EFF-3.0<br />
and also to check that<br />
0.6<br />
MCNP/FENDL-2<br />
DORT/FENDL-2<br />
the uncertainties in the<br />
0.5<br />
MCNP/JENDL-FF<br />
Total error<br />
cross sections were<br />
0.4<br />
compatible with the<br />
0 10 20 30 40 50 60<br />
experimental findings.<br />
Penetration depth (cm)<br />
C/E<br />
Fig. 3.15 - C/E values for<br />
the neutron flux in the<br />
fusion peak energy range<br />
E > 10 MeV, measured by<br />
the activation technique<br />
using the Nb-93(n,2n)<br />
reaction.<br />
3.5.6 Experimental validation of neutron cross sections for fusion<br />
materials (EAF project)<br />
Chromium is one of the candidate structural materials for a fusion reactor because of<br />
its activation properties. In a relatively short time, pure chromium reaches the<br />
conventional activity and dose-rate limits for disposal and maintenance. In the<br />
framework of the activity for the validation of activation cross sections in the<br />
European Activation File (EAF), a sample of chromium (manufactured by<br />
PLANSEE) was irradiated by the 14-MeV FNG [3.38]. The induced activation was<br />
measured by standard and very low background gamma spectroscopy detectors<br />
(HPGe) located in the Gran Sasso (Italy) underground laboratories.<br />
The sample was irradiated for about six hours at the maximum neutron flux<br />
produced by FNG. The neutron flux and spectrum are well monitored by the<br />
multifoil activation technique. The total neutron fluence at the sample was 4.87×10 12<br />
n/cm 2 ± 3%. After irradiation, the activity was measured for several decay times<br />
ranging from fifteen minutes to three months.<br />
[3.38] M. Pillon, M.<br />
Angelone, Final report<br />
of Task TTMN-002 (5)-<br />
002, Report FUS- TEC-<br />
MA-NE-R-2001 (2001)<br />
The calculations were carried out with the latest version of EAF (2001). The typical<br />
material composition supplied by PLANSEE was input in the EASY code. These<br />
maximum values of impurities were used for the C/E comparison. The<br />
radionuclides not included in the EASY code were determined by measuring their<br />
activity.<br />
The results of the C/E comparison and uncertainty analysis are reported in table 3.II.<br />
The radionuclides in bold are those produced by the impurities in the chromium<br />
sample. The amount is given in Wppm, together with the total uncertainty.<br />
The data in table 3.II show the good quality of the EAF-2001 cross-section data, since<br />
most of the C/E values are, within the uncertainties, close to one. The only exception<br />
is the radionuclides produced by the so-called sequential charge particle reaction<br />
(SCPR), i.e., a two-step reaction like (n,p) → (p,n), which occurs with high-energy<br />
neutrons. These reactions are treated by the EASY system, but in an approximate<br />
way. Another radionuclide which shows a large discrepancy is the V-48 produced by<br />
the reaction Cr-50(n,t)V-48. This is a threshold reaction with the energy threshold<br />
close to the maximum FNG neutron energy, and it is most probable that there are<br />
some errors in the cross-section values near the threshold energy. The experimental<br />
results indicate that these values are overestimated. The high C/E value obtained for<br />
Na24 may be due to the fact that the maximum impurity level for Al and Mg was<br />
used.
3. FUSION TECHNOLOGY 81<br />
Table 3.II - C/E comparison results<br />
Nuclide Half life C/E Exp. err. Cal. err. Production pathways %<br />
V-52 3.7 m 0.94 13.6 % 10.6%<br />
Cr52(n,p)V52 97.0<br />
Cr53(n,d)V52 3.0<br />
CR-49 42 m 0.89 19.1 % 7.1% Cr50(n,2n)Cr49 100.0<br />
MN-52 6 d 2.99 7.3 % Cr52[p,n]Mn52 100.0<br />
V-48 16 d 3.45 43.4% 20.0% Cr50(n,t)V48 100.0<br />
CR-51 28 d <strong>1.</strong>03 8.5% 5.0% Cr52(n,2n)Cr51 100.0<br />
MN-54 312 d 0.37 3.8%<br />
MN-56 2.6 h <strong>1.</strong>08 20.2% 3.2%<br />
Cr54[p,n]Mn54 5<strong>1.</strong>3<br />
Fe54(n,p)Mn54 48.7<br />
Fe56(n,p)Mn56 99.1<br />
Fe57(n,d)Mn56 0.9<br />
Mg24(n,p)Na24 17.8<br />
Mg25(n,d)Na24 0.5<br />
NA-24 15 h 3.13 12.0% 35.5% Al27(n,a)Na24 50.7<br />
Mg24(n,p)Na24m(IT)Na24 8.0<br />
Al27(n,a)Na24m(IT)Na24 22.7<br />
CO-58 70.9 d <strong>1.</strong>0 9.1% 57.3%<br />
Ni58(n,p)Co58 95.1<br />
Ni58(n,p)Co58m(IT)Co58 4.9<br />
New radionuclides found Parent nuclide Error Production pathways %<br />
Wppm<br />
SC-46 83.8 d 0.5 53.1%<br />
3.5 Neutronics<br />
Ti46(n,p)Sc46 58.1<br />
Ti47(n,d)Sc46 18.8<br />
Ti46(n,p)Sc46m(IT)Sc46 15.1<br />
Ti47(n,d)Sc46m(IT)Sc46 8.0<br />
Y-88 107 d 5.1 14.3% Y89(n,2n)Y88 100.0<br />
Activity(Bq/kg)<br />
1015<br />
1013<br />
1011<br />
109<br />
107<br />
105<br />
103<br />
101<br />
10-1<br />
10-6<br />
+ V52<br />
ILW/LLW Limit<br />
IAEA Limit<br />
Material and impurities + SCPR<br />
Pure material<br />
10-4<br />
10-2<br />
Fig. 3.16 - Comparison<br />
between pure Cr sample<br />
and Cr sample containing<br />
impurities irradiated in a<br />
first-wall spectrum for an<br />
equivalent neutron flux of<br />
1 MW/m 2 .<br />
+ Cr51 + V49<br />
Time after irradiation (years)<br />
+ Fe55 + H3<br />
+ + Ar39<br />
Ni63 + C14<br />
100 102 104<br />
3.6.1 IVROS articulated boom<br />
Comparison between the experimental data and the<br />
EASY prediction for the chromium sample indicated that<br />
the data libraries are adequate for a good estimation of<br />
the neutron-induced activation of the sample.<br />
Figure 3.16 compares the radiation induced in a pure<br />
chromium sample and that induced in the sample with<br />
the impurities plus the SCPR predicted by EASY. The<br />
reactions that contribute to long lasting radioactivity are<br />
N14(n,p)C14 and K39(n,p)Ar39 +Ca40(n,2p)Ar39.<br />
3.6 Remote Handling<br />
During 2001, some first-wall maintenance and inspection tasks were performed<br />
according to the scheduled FTU shutdown. Two limiter sectors were replaced<br />
remotely by means of the in-vessel remote operating system (IVROS) (fig. 3.17). A
82<br />
3. FUSION TECHNOLOGY<br />
3.6 Remote Handling<br />
new setup of the multilink control software was developed and<br />
tested. An experimental campaign to assess the inspection<br />
procedure was successfully completed.<br />
3.6.2 Upgrade of DRP heavy<br />
manipulator/crane/trolley<br />
Much of the remote handling equipment installed in the divertor<br />
refurbishment platform (DRP) is for use with direct viewing, but<br />
as the ITER hot cell is likely to be displaced from its control room,<br />
direct viewing will not be possible. The first stage in upgrading<br />
the existing handling equipment is to include position sensing on<br />
all eleven axes of the heavy lifting and transport equipment. This<br />
will assist the operator in reproducing key positions accurately<br />
and paves the way for the next stage of the upgrading, which is<br />
to include both automatic positioning of these axes, under the<br />
control of a teach file, as well as the possibility to create a virtual<br />
environment (i.e., a computer model) of the hot cell.<br />
Fig. 3.17 - Toroidal limiter<br />
sector replacement by<br />
IVROS robotic arm.<br />
3.6.3 Trials using ITER FDR 98 duct equipment in<br />
real remote conditions<br />
The remaining work on the divertor test platform (DTP) will<br />
focus on gaining experience with the installed remote handling<br />
equipment in real conditions. The Canadian duct vehicle was<br />
used to carry out a series of representative trials, i.e.,<br />
bolting/unbolting vacuum vessel door fixings, and<br />
bolting/unbolting, and later installation and removal of, rail<br />
sections. The trials were performed in the DTP control room,<br />
without any access to or direct viewing of the handling<br />
equipment.<br />
3.6.4. Installation, commissioning and trials with<br />
the CEA/Cybernetix MAESTRO radiation-hard<br />
servo-manipulator arm on DTP cassette toroidal<br />
mover<br />
This was a long-planned task that underwent extensive delays<br />
due to technical problems with the hydraulic arm. The<br />
equipment was delivered and installed late in 2001, following a<br />
series of interface control and planning meetings held at <strong>ENEA</strong><br />
Brasimone and at the CEA headquarters in Paris. The result was<br />
a successful demonstration of the capability of MAESTRO (fig.<br />
3.18) to operate in the confined space of the divertor region and<br />
handle a heavy hydraulic tool to tighten the cassette locking<br />
system following cassette installation.<br />
3.6.5 High-discharge electrical tests of multilink attachment pin<br />
concept at CESI<br />
Although other EURATOM Associations had carried out a series of (mainly)<br />
mechanical tests to establish the suitability of the multilink concept, its capability to<br />
safely carry the thousands of amperes of halo current anticipated during operation<br />
remained untested. Thus, two series of planned trials were performed at the Centro<br />
Fig. 3.18 - MAESTRO<br />
environment at Brasimone.<br />
The slave arm is<br />
between the yellow<br />
cassette toroidal mover<br />
and the blue cassette.
3. FUSION TECHNOLOGY 83<br />
Elettrotecnico Sperimentale (CESI) Milan, with currents of 10, 20 and 30 kA for short<br />
periods. The results (reported to EFDA) indicate that the multilink can safely pass<br />
the current.<br />
3.6.6 Final DRP trials using ITER FDR 98 cassette mockup with<br />
multilink attachments<br />
The latest multilink method for attaching the plasma-facing components to the<br />
divertor cassette was commissioned in the DRP. The final series of trials utilising the<br />
original 1998 FDR design cassette mockup was completed in early 2001 and reported<br />
to EFDA. Further multilink trials await a major upgrade to the DRP environment to<br />
include a new ITER FEAT cassette mockup and associated tooling and handling<br />
equipment.<br />
3.6.7 In-vessel viewing and ranging<br />
3.6 Remote Handling<br />
The 2001 activities, performed in collaboration with <strong>ENEA</strong>’s Applied Physics<br />
Division, included the design, development, manufacturing and testing of the invessel<br />
viewing probe (LIVVS; viewing accuracy ± 1 mm at 10 m) to be installed and<br />
tested at JET and the in-vessel viewing & ranging probe (IVVS; ranging ± 0,3 mm at<br />
5 m) for ITER. Both systems are based on the amplitude-modulated laser beam<br />
technique.<br />
A new mechanical design of LIVVS was done to meet the new JET EFDA<br />
specifications and to overcome the scanning head oscillation problems. LIVVS is<br />
scheduled for complete testing within July 2002, and a suitable testing period has to<br />
be identified in the JET experimental program.<br />
The IVVS components were all procured and the complete system is being<br />
assembled: the overall probe dimensions (scanning head + launching and receiving<br />
optics) are within 800×160×160 mm. The related optical and electronic parts were<br />
successfully developed. Figure 3.19 shows an example of the IVVS viewing and<br />
ranging performances. Complete testing of the probe should be completed within<br />
2002. Possible applications for other viewing and ranging activities in the ITER<br />
system (glove boxes,…) are now under study with the EFDA Close Support Unit.<br />
Fig. 3.19 - IVVS viewing<br />
and ranging performance:<br />
a) coin photo; b) IVVS<br />
view of coin; c) IVVS<br />
ranging of coin. Note<br />
submillimetric viewing &<br />
ranging performance<br />
compared with actual coin<br />
dimensions.<br />
3.7.1 Compatibility of SiC f<br />
/SiC composites with Pb-17Li<br />
3.7 Materials<br />
The 2001 work was a continuation of the studies on the compatibility of SiC f /SiC<br />
composite with liquid Pb17Li at about 550°C for exposure times of 100, 1000 and<br />
6000 h in physical-chemical conditions representative of those of the TAURO blanket
84<br />
3. FUSION TECHNOLOGY<br />
3.7 Materials<br />
(liquid metal velocity 0.5-1 m/s). The aim is to quantify<br />
eventual degradation of the mechanical and elastic<br />
properties of the composite because of corrosion, with the<br />
use of nondestructive techniques including geometrical<br />
dimensions, mass variation, longitudinal and torsional<br />
dynamic moduli of elasticity (by the longitudinal and<br />
torsional fundamental resonant frequency method).<br />
The materials to be investigated include CERASEP N31, N41<br />
and <strong>ENEA</strong> PIP composites.<br />
The upgrading of the LIFUS2 facility at <strong>ENEA</strong> Brasimone to<br />
increase the exposure temperature to 550°C was completed.<br />
The exposure phase was completed for 100 and 1000 h. The<br />
characterisation of the samples exposed for 100 h showed the<br />
absence of erosion-corrosion phenomena but the presence of<br />
consistent liquid infiltration (fig. 3.20). The characterisation of the samples exposed<br />
for 1000 and 6000 h is ongoing.<br />
3.7.2 Microstructural investigation of radiation effects in RAFM<br />
steel by SANS<br />
These activities are carried out in collaboration with FZK. Small-angle neutron<br />
scattering (SANS) measurements were performed at the High Flux Reactor of ILL-<br />
Grenoble. An automatic sample changer designed for handling highly activated<br />
material (up to 1 Sv at 10 cm) was developed. OPTIFER (I and V) and F82H steels,<br />
neutron irradiated at 250-450°C with 2.8 dpa, with and without post-irradiation<br />
annealing at 525 and 700°C, were investigated. Non-irradiated oxide dispersion<br />
strengthened (ODS) EUROFER97 samples (up to 0.5% Y 2 O 3 ) were also examined.<br />
Under 2.8 dpa irradiation, the SANS cross section increases remarkably compared to<br />
the non-irradiated samples, which reflects the presence of defects, such as He<br />
bubbles. The ratio nuclear +<br />
<strong>magnetic</strong>/nuclear scattering changes<br />
significantly under irradiation, which<br />
is a sign of changes in precipitate<br />
composition. The difference between<br />
the irradiated and reference<br />
samples appears to be independent<br />
of the orientation relative to<br />
the applied <strong>magnetic</strong> field in the postirradiated<br />
35.0<br />
28.0<br />
2<strong>1.</strong>0<br />
heat-treated specimens.<br />
This can be attributed to the 14.0<br />
growth of He bubbles. Figure 3.21<br />
shows a comparison of oxide 7.0<br />
particle distributions obtained by<br />
transmission electron microscopy 0.0<br />
(TEM) and SANS for the EUROFER97<br />
0.0 7.0 14.0 2<strong>1.</strong>0 28.0 35.0<br />
ODS samples.<br />
d (nm)<br />
Rel. frequency<br />
Fig. 3.20 - SEM<br />
micrograph of sample<br />
exposed for 100 h,<br />
showing heavy Pb-17Li<br />
infiltration.<br />
Fig. 3.21 – Oxide particle<br />
distributions in EURO-<br />
FER97 ODS 0.3%.<br />
Continuous line: data from<br />
SANS measurements.<br />
Dashed line: histogram<br />
from TEM (Lindau et al.,<br />
ICFRM 10 Proc.)<br />
3.7.3 Mechanical properties of RAFM steel-base material and joints<br />
The isothermal low cycle fatigue (LCF) programme without hold-time was<br />
completed on both EUROFER97 and F82H mod. The final results confirmed the<br />
behaviour found for the first set of tests. Both steels behaved like other hardened and<br />
tempered martensitic alloys: no hardening was observed either for a strain-range of
3. FUSION TECHNOLOGY 85<br />
3.7 Materials<br />
<strong>1.</strong>5%. Also confirmed was the higher LCF resistance of F82H mod steel at 450°C and<br />
moderate strain-range (0.4-0.75%). The few data obtained so far (at R σ =<strong>1.</strong>5) are not<br />
sufficient to state whether a larger compressive strain (and related stress) has a<br />
significant effect on the moderate variation of the number of cycles to failure<br />
observed.<br />
Results obtained by submitting EUROFER97 to continuous thermal cycling from 200<br />
to 600°C (without hold time) showed that the behaviour of this alloy is similar to that<br />
found for F82H steel tested in the same conditions. A series of thermal fatigue tests<br />
was carried out with a different temperature range (thermal boundaries T min from<br />
150 to 250°C, T max from 450 to 650°C). The results showed that EUROFER97 has a<br />
slightly better resistance but a higher spread than F82H.<br />
Structural investigation of EUROFER97 welded joints was done by means of x-ray<br />
diffraction. Electron beam welded (EBW) joints on 8-mm- and 25-mm-thick plates<br />
were made at <strong>ENEA</strong> Casaccia. The non-destructive examinations (dye penetrant and<br />
ultrasonic) showed the presence of macroscopic cracks on the 25-mm-thick welded<br />
plate. The flaws were discovered during strip sharing of the plate and were observed<br />
all along the joint. Other EB welds were made, but the same serious drawback was<br />
found. Examination revealed a crack (between 500 and 2000 µm wide) extending all<br />
along the joint. This flaw seems to be a solidification or liquation crack. Owing to the<br />
unsuitability of these welds for mechanical testing, the only activity related to EBW<br />
concerned the study of post-welding heat treatment (PWHT). The as-welded<br />
Vicker’s hardness ranges from 400 to 415 kg/mm 2 , which is a typical value for an<br />
untempered martensitic structure, so the material is too brittle for structural<br />
applications. PWHTs at 730 and 760°C (soaking time 1 h) decreased the hardness to<br />
250-210 kg/mm 2 , so PWHT is a mandatory process. Further investigations on<br />
EUROFER97 weldability are necessary.<br />
Tensile and impact property testing of commercial as-received ODS PM 2000 and<br />
ODS EUROFER97 was carried out. The ODS PM 2000 steel appears less resistant<br />
than the ODS EUROFER97, as expected since PM 2000 is a ferritic, nontransformable<br />
alloy. On the other hand, impact resistance seems slight higher (6 J<br />
instead of ≈ 5 J), while the ductile-to-brittle transition temperature for both materials<br />
is within 100-140°C. Thermal ageing was performed at 550°C for 1000 and 5000 h.<br />
The tensile properties of aged specimens (testing temperature R.T., 450 and 650°C)<br />
are fully comparable to those of un-aged material. The ageing temperature seems to<br />
be too low to have any structural modification, so PM 2000 appears very stable at this<br />
temperature.<br />
[3.39] M. F. Maday,<br />
Fusion Technol. 39, 2,<br />
596 (2001)<br />
[3.40] M.F. Maday,<br />
Mechanisms governing<br />
fracture of cyclically<br />
loaded F82H mod. steel<br />
in air and water at<br />
240°C, presented at<br />
ICFRM-10 (Baden Baden<br />
2001), to appear in J.<br />
Nucl. Mat.<br />
3.7.4 Low-cycle fatigue of RAFM steel in water with additives<br />
The objective of the experimental activity carried out in 2001 was to complete the<br />
comparative study of the LCF behaviour of two different plates (31W-19 and 42W-<br />
18) of F82H mod heat 9753 already undertaken in pure oxygen-free water [3.39]. The<br />
tests done in the alkaline chemistry recommended for DEMO coolant to establish<br />
eventual correlations between the observed fatigue performances and steel<br />
microstructure were replicated. The nature of the underlying damaging mechanism<br />
was clarified with the support of meaningful experimental indexes. Preliminary LCF<br />
property evaluations of EUROFER97 were also carried out.<br />
With the experimental conditions used [3.40], the fatigue lives and associated<br />
fracture modes reported in figure 3.22 were obtained on specimens from 31W-19<br />
(group I) and from 42W-18 (groups II and III). In water, a minor degree of fatigue<br />
lifetime reduction with respect to air data and an associated minor tendency to<br />
plastic deformation localisation were observed on F82H-31W-19, which included an
86<br />
3. FUSION TECHNOLOGY<br />
3.7 Materials<br />
600<br />
g<br />
f<br />
Air reference curve (groups I,II,III)<br />
560<br />
LiOH water/group I<br />
LiOH water/group II<br />
LiOH water/group III<br />
520<br />
d<br />
Stress amplitude (MPa)<br />
480<br />
440<br />
400<br />
360<br />
320<br />
280<br />
240<br />
e<br />
c<br />
b<br />
a<br />
1 10 100 1000 10000 10000<br />
Numbers of cycles to fracture (Nf)<br />
Fig. 3.22 - F82H mod<br />
specimen: number of<br />
cycles to rupture and<br />
associated macroscopic<br />
fracture aspects after<br />
LCF testing in air and<br />
LiOH-dosed oxygen-free<br />
water at 240°C.<br />
extra population of dispersed and large Al-oxides. Specimens from 42W-18,<br />
containing residual stresses from machining, exhibited the worst LCF performances.<br />
The fractures were either brittle and frequency-dependant or cup-cone and cycledependant,<br />
and involved lath boundaries, oxide/matrix interfaces or carbide/matrix<br />
interfaces.<br />
Based on thermodynamics, fractography and on environment-induced bulk effect<br />
considerations, a hydrogen assisted cracking mechanism for steel fracture<br />
enhancement in a water environment was strongly suggested.<br />
In the light of the above data, the preferred fracture paths for F82H cracking<br />
propagation and fatigue behaviour variability from plate-to-plate were explained<br />
with the hydrogen decohesion theory, i.e., different and concurrent hydrogen trap<br />
populations in the F82H microstructure and fracture behaviour kinetically favoured<br />
at specific sites trigger the fracture event.<br />
3.7.5 Development of a low-activation brazing technique for<br />
SiC f<br />
/SiC composites<br />
The requirements of a fusion-relevant brazing technique are low neutron activation,<br />
good compatibility with breeders, low brazing temperature to avoid fibre<br />
degradation, good wettability with the composite, thermal expansion coefficient<br />
similar to that of the composite and sufficient shear strength. Pure silicon has good<br />
chemical compatibility and wettability with silicon carbide and has been used both<br />
to infiltrate and to join samples. It also has a thermal expansion coefficient similar to<br />
that of silicon carbide. On the other hand, the quite high melting temperature of<br />
silicon, the limited strength exhibited in previous work and the neutron-induced<br />
swelling of pure silicon make its use rather problematic in a fusion reactor<br />
environment. The basic idea for the development of a new alloy and brazing<br />
technique was to use a Si-16Ti (at%) eutectic (melting temperature 1330°C). Si16Ti<br />
has a lower melting point and the titanium enhances the joint strength via the<br />
formation of intermetallic compounds and/or carbide at the interface with SiC [3.41].<br />
Several experiments were performed to obtain the eutectic “in situ” by melting Si-Ti<br />
[3.41] B. Riccardi et al.,<br />
“Low activation brazing<br />
materials and techniques<br />
for SiC f /SiC composites”<br />
presented at ICFRM-10<br />
(Baden Baden 2001), to<br />
appear in J. Nucl. Mat.
3. FUSION TECHNOLOGY 87<br />
3.7 Materials<br />
powder mixtures at >1430°C, but the results were not<br />
satisfactory because of incomplete melting of the mixtures,<br />
which led to inhomogeneities and defects. Thus, before the<br />
brazing operations, the eutectic was prepared by melting a Si-<br />
Ti mixture in an argon plasma furnace and then re-melting it<br />
in an electron beam to get a fine eutectic structure. Powders<br />
were prepared by milling the small ingots obtained and were<br />
then used for the brazing experiments. First monolithic and<br />
then SiC f /SiC composites samples were brazed.<br />
Fig. 3.23 - Si-Ti brazed<br />
joint micrography.<br />
The joining was performed in both vacuum and inert<br />
atmosphere. The joints had a very interesting morphology<br />
(fig. 3.23). In particular, the joint layer showed:<br />
• the absence of discontinuities and defects at the interface as<br />
a result of complete melting of the powders;<br />
• a fine eutectic structure with morphology comparable to that of the starting<br />
powder.<br />
Fig. 3.24 - Calculated<br />
stress distribution in the<br />
sample.<br />
[3.42] C.A. Nannetti, et<br />
al., Development of 2D<br />
and 3D Hi Nicalon<br />
fibres/SiC matrix<br />
composites manufactured<br />
by a combined CVI-PIP<br />
route, presented at<br />
ICFRM-10 (Baden Baden<br />
2001), to appear in J.<br />
Nucl. Mat.<br />
A shear test performed at room temperature by means of a modification of the ASTM<br />
D905-89 standard method gave remarkable results: the samples manufactured with<br />
monolithic SiC cracked at high shear stress level, not in the brazing layer or at the<br />
interface, but in the SiC bulk; while the composite samples exhibited up to 80 MPa<br />
shear strength.<br />
3.7.6 Measurement of residual stresses using neutron diffraction<br />
techniques<br />
In the framework of Underlying Technology, samples of high-heat-flux<br />
components were tested in the ILL High Flux Reactor (Grenoble) to verify the<br />
relevance of the<br />
Residual Stress (MPa)<br />
400<br />
300<br />
200<br />
100<br />
0<br />
-100<br />
-200<br />
-300<br />
-400<br />
-500<br />
Glidcop<br />
5 10 15 20 25<br />
Tungsten<br />
Position (mm)<br />
Long in-plane<br />
Short in-plane<br />
Normal<br />
Interface<br />
3.7.7 SiC/SiC ceramic composites as PFC material<br />
compliance layer in the<br />
stress evolution of the first<br />
sample tested. Preliminary<br />
results show that the<br />
strains in Glidcop vanish<br />
at about 300°C, indicating<br />
a possibility to evaluate<br />
the null strain temperature,<br />
if the lattice is not<br />
deformed by the<br />
compliance layer. Figure<br />
3.24 shows the calculated<br />
stress distribution.<br />
The campaign to manufacture composites with superior properties (Underlying<br />
Technology activity) continued during 200<strong>1.</strong> In particular, the objective was to<br />
evaluate the effect of densification by chemical vapour infiltration (CVI) and<br />
polymeric infiltration and pyrolysis (PIP) on the thermal/mechanical properties of<br />
Tyranno SA/SiC matrix composites and to compare the results with those of similar<br />
3-D fibre textures of Hi-Nicalon/SiC matrix composites densified by CVI-PIP [3.42].<br />
The fibre volumetric percentage ranged from 35 to 40% and the thickness was about<br />
4 mm.
88<br />
3. FUSION TECHNOLOGY<br />
3.7 Materials<br />
The first step of the densification process was the deposition of a 0.10 mm pyrolithic<br />
carbon by chemical vapour deposition (CVD). Afterwards a first layer of SiC was<br />
provided by CVD for 20 h for a thickness of 0.20 mm. Then, infiltration with polymer<br />
and SiC alpha particles was performed followed by pyrolysis at 1300°C. Finally, an<br />
additional six cycles of PIP were performed without adding any SiC powders. For<br />
comparison, 2-D and 3-D panels were also manufactured without any powder<br />
addition in the first PIP cycle, but the number of PIP cycles was increased to 14. The<br />
micrographs (fig. 3.25) of the 2-D and 3-D composites (manufactured by SiC powder<br />
injection) show that good intrabundle infiltration and a fine, well distributed<br />
porosity was reached. Table 3.III Shows the main properties of the composites<br />
manufactured.<br />
The use of powder during the first PIP cycle seems to reduce the porosity for both<br />
the 2-D and 3-D composites compared to the standard PIP technology, even with a<br />
high number of cycles. Powder injection and advanced SiC fibres marginally increase<br />
thermal conductivity/diffusivity. The 3-D textures show a higher thermal<br />
conductivity than the 2-D, but a high fraction of fibres across the thickness is not a<br />
big advantage without a high crystallinity matrix. A sufficient bending strength was<br />
measured for all the composites produced by PIP+powders, but the 2-D composites<br />
show a better bending strength, probably due to the higher fibre content. In addition,<br />
the mechanical properties of Tyranno SA/SiC composites are generally lower than<br />
the properties of Nicalon CG or Hi Nicalon fibre/SiC composites.<br />
a) b)<br />
Fig. 3.25 - <strong>ENEA</strong> 2-D (a)<br />
and 3-D (b) composite<br />
micrographs.<br />
Table 3.III - Main properties of the manufactured composites<br />
Panel sample<br />
Fibre density Porosity Th.diffusivity Th.conductivity MOR<br />
% (g/cm 3 ) % (cm 2 /s) [W/(mK)] (MPa)<br />
2-D-A 40.5 2.36 15 0.027 4.2 391<br />
(no powders 13PIP)<br />
2-D-B 43.6 2.54 1<strong>1.</strong>5 0.045 7.5 496<br />
2-D-C 40.6 2.51 13.4 n.a. -- 511<br />
3-D-A 34.9 2.48 12 0.07 1<strong>1.</strong>4 409<br />
(no powders 13 PIP)<br />
3-D-B 34.9 2.56 1 0.6 0.065 10.9 411<br />
3-D-C 36.5 2.62 8.4 n.a. -- 506<br />
3-D-D 37.2 2.6 10.6 n.a. -- 499
3. FUSION TECHNOLOGY 89<br />
3.7.8 Mechanical characterisation of materials with miniaturised<br />
specimens<br />
Development of the portable flat-top indenter for mechanical characterisation<br />
(FIMEC) continued in 200<strong>1.</strong> Following the achievement of the demonstrative<br />
apparatus for in situ testing, which is based on the use of a 0.7-mm-diam flat<br />
indenter, a portable prototype was designed. Work was also started on developing a<br />
numerical methodology as a comprehensive tool for interpreting the load<br />
penetration curves of different materials.<br />
Two options of the portable FIMEC apparatus were analysed: The first is based<br />
on the same stepping motor and load displacement detection features as used in<br />
the fixed apparatus; the second is more compact and has a different layout, with<br />
an encoder, a small motor and a kinematic chain which drives the indenter tip.<br />
Both solutions are provided with a fixing tool suitable for cylindrical and flat<br />
geometry.<br />
3.8.1 Interaction between lead-lithium alloy and water in DEMOrelevant<br />
conditions (EU Task TTBA-5)<br />
Large water leaks<br />
3.7 Materials<br />
3.8 Liquid Metal Technology and<br />
Hydrogen Effects on Materials<br />
The interaction between molten lead-lithium alloy (in a eutectic composition) and<br />
pressurised water is studied to predict the behaviour of a water-cooled lithium-lead<br />
(WCLL) blanket module in the case of a cooling-tube rupture.<br />
In 2001, three tests (#3,4,5) were conducted at the LIFUS 5 apparatus at <strong>ENEA</strong><br />
Brasimone in thermal-hydraulic conditions similar to those foreseen for the WCLL<br />
DEMO blanket.<br />
In test #3, water was injected into the reaction tank at a pressure of 155 bar with<br />
different values of sub-cooling and different free volumes in the expansion vessel.<br />
The initial liquid metal temperature was fixed at 330°C.<br />
In test #4, the water temperature was fixed at 325°C (corresponding to a water subcooling<br />
of about 20°C), the free volume of the expansion vessel was 5 l and the<br />
duration of water injection was 6 s. After about 2 s from the beginning of the test, the<br />
rupture disk D1 (on the line connecting the expansion vessel to the dump tank)<br />
failed, with subsequent depressurisation of the system. Because of the large amount<br />
of injected water, a significant heat effect was also found; a maximum temperature of<br />
683°C was detected in the upper part of the reaction vessel, with an increase of 353°C<br />
over the initial value.<br />
In test #5, water was injected at 265°C, the compressibility of the system was reduced<br />
by decreasing the free volume in the expansion vessel from 5.0 to 4.0 l and the time<br />
of water injection was increased to 12 s. During the experiment, 3.28 kg of water were<br />
injected into the reaction vessel. A maximum temperature of 525°C was detected in<br />
the upper part of the reaction vessel, about 10 s from the beginning of the test, with<br />
an increase of 195°C over the initial value.<br />
Comparing tests #3 and 5, it appears that the free volume in the expansion vessel is<br />
much more significant than the water enthalpy in determining the pressurisation<br />
evolution of the blanket module. This consideration is confirmed by comparing tests<br />
#4 and 5.
90<br />
3. FUSION TECHNOLOGY<br />
3.8 Liquid Metal Technology and<br />
Hydrogen Effects on Materials<br />
Pressure (bar)<br />
160<br />
140<br />
120<br />
100<br />
80<br />
PT1(5)<br />
60<br />
PT2(5)<br />
PT1(4)<br />
40<br />
PT2(4)<br />
PT1(3)<br />
20<br />
PT2(3)<br />
0<br />
0 200 400 600 800 1000 1200 1400 1600 1800 2000<br />
Time (ms)<br />
Fig. 3.26 - Comparison of pressure evolution in tests<br />
#3, 4 and 5.<br />
Temperature (C)<br />
650<br />
600<br />
550<br />
500<br />
450<br />
400<br />
350<br />
300<br />
0 5000 10000 15000 20000 25000<br />
Time (ms)<br />
TC1 test n. 3<br />
TC1 test n. 4<br />
TC1 test n. 5<br />
Fig. 3.27 - Comparison of temperature evolution in<br />
tests #3, 4 and 5.<br />
The behaviour of the pressure and of the temperature vs. time is reported in figures<br />
3.26 and 3.27. Note that the temperature evolutions have similar behaviour until the<br />
failure of the rupture disk.<br />
Small water leaks<br />
The interaction between pressurised water and liquid Pb-17Li, as a consequence of<br />
coolant micro-leaks inside a WCLL blanket module, is a relevant issue and needs to<br />
be studied because of the potential consequences. This issue was evaluated through<br />
an extensive experimental campaign on the RELA loops, which was concluded with<br />
the last test (no.9) performed on RELA III during 200<strong>1.</strong><br />
The main operating conditions (lithium-lead velocity 5 mm/s and temperature<br />
330°C in the test section, water-circuit pressure155 bar) were chosen taking into<br />
account the thermal-hydraulic parameters foreseen for the DEMO WCLL blanket<br />
module.<br />
In the last test, the water injection was stopped three hours from the beginning of the<br />
injection phase because of the total interruption of the Pb-17Li flow rate in the circuit.<br />
A total of 1051 grams of water were injected, and 30.5 mol of hydrogen were<br />
recovered by the Ar stream. The molar ratio between the hydrogen and the injected<br />
water was 0.52. The evolution with time of the hydrogen concentration and water<br />
leak rate is shown in figure 3.28. No differences were found in hydrogen recovery<br />
passing from sweeping to bubbling argon in the storage/re-circulation vessel.<br />
Because of the low<br />
linear velocity of the<br />
liquid metal inside the<br />
test section of the<br />
RELA loops (the same<br />
as foreseen in the<br />
ITER and DEMO<br />
WCLL blanket<br />
module) and the high<br />
melting point of some<br />
reaction products of<br />
the chemical reaction<br />
between lithium and<br />
water, a solid shell is<br />
Water leak rate (g/s)<br />
0.25<br />
0.2<br />
0.15<br />
Water leak rate<br />
0.1<br />
0.05<br />
H 2 concentration<br />
0<br />
4000 6000 8000 10000<br />
Time (s)<br />
6<br />
5<br />
4<br />
3<br />
2<br />
1<br />
0<br />
H2 (%)<br />
Fig. 3.28 - Hydrogen<br />
concentration and water<br />
leak rate during test #9<br />
on Rela III.
3. FUSION TECHNOLOGY 91<br />
3.8 Liquid Metal Technology and<br />
Hydrogen Effects on Materials<br />
formed around the microcrack, enveloping the part of the cooling pipes close to it.<br />
The dimension of this solid aggregation depends on the amount of water injected as<br />
well as on the tube area density. This phenomenon has two main consequences: a<br />
reduction in the liquid metal flow-rate, which, at most, can completely stop, and a<br />
reduction in the heat exchange coefficient, on the liquid metal side, which can cause<br />
hot thermal spots.<br />
In any case, depending on the thermal hydraulic conditions in the module, a part of<br />
the solid reaction products can be removed from the module through the return line<br />
of the circuit. As a consequence, to avoid total or partial obstruction of the pipe<br />
because of plugging, particular care has to be taken in designing the return line to<br />
avoid long horizontal parts as much as possible.<br />
No corrosive effects on the microcrack were found, and the variation with time of the<br />
water micro-leak is to be ascribed only to the formation of solid reaction products<br />
just at the mouth. Consequently, the probability of a “self” stopped microleak is not<br />
negligible.<br />
The amount of hydrogen produced from the chemical reaction between lithium and<br />
water is about 0.3-0.5 mol H 2 per mole of injected water; this data scattering is<br />
probably due to the trapping of un-reacted water inside the solid aggregation<br />
developed around the microcrack. This confirms that, for this particular kind of<br />
interaction, the main solid reaction product is lithium hydroxide (LiOH), while only<br />
the external surface of the solid aggregation contains lithium oxide (Li 2 O).<br />
The hydrogen concentration is more or less in phase with the variation with time of<br />
the water microleak. This means that, particularly for systems of limited dimension<br />
(such as in the WCLL TBM), the hydrogen concentration as detected on the cover gas<br />
could be used, in principle, as a water microleak detector.<br />
3.8.2 Qualification of tritium permeation in Pb-17Li/gas<br />
Aluminium-rich coatings (which form Al 2 O 3 at their surface) produced by CVD and<br />
hot dipping (HD) processes have been selected as the reference solution for the<br />
tritium permeation barriers (TPBs) of the DEMO WCLL blanket.<br />
Fig. 3.29 - Arrenhius plot<br />
of CVD-coated specimen<br />
permeabilities (gas<br />
phase).<br />
The internal surface of the specimen is initially in contact with the vacuum (10-5 Pa),<br />
and the external surface is exposed to hydrogen gas with a nominal purity of<br />
99.9999%. The hydrogen permeates in the sample and causes a pressure rise in the<br />
inner volume. The pressure rise can be converted into the amount of gas in moles<br />
permeating through the unit area of the sample per second. The procedure can be<br />
repeated for different temperatures and<br />
gas flows.<br />
T(K)<br />
Φ (mol m-1s-1Pa-1/2)<br />
1 . 10-11<br />
1 . 10-12<br />
<strong>1.</strong>3<br />
750<br />
<strong>1.</strong>4<br />
700<br />
<strong>1.</strong>5<br />
650<br />
<strong>1.</strong>6<br />
1000/T (1/K)<br />
600<br />
<strong>1.</strong>7<br />
550<br />
CVD1 T increase<br />
CVD2 T increase<br />
CVD1 T increase<br />
CVD2 T increase<br />
Reference specimen<br />
Disk shaped sample<br />
<strong>1.</strong>8<br />
The permeation reduction factor (PRF)<br />
of the CVD-coated specimens was very<br />
poor, probably because of an incorrect<br />
coating procedure. The specimens were<br />
tested only in the gas phase, and the<br />
results are depicted in terms of<br />
permeabilities in the Arrenhius plot of<br />
figure 3.29. Only one HD specimen of<br />
the two tested gave acceptable results in<br />
the gas phase, while the PRF was<br />
significantly lower in the liquid metal<br />
than in the gas the phase (fig. 3.30).
92<br />
3. FUSION TECHNOLOGY<br />
3.8 Liquid Metal Technology and<br />
Hydrogen Effects on Materials<br />
A second experimental campaign on CVD- and HD-coated<br />
specimens was started at the end of 200<strong>1.</strong><br />
3.8.3 Transport parameters and solubility of<br />
hydrogen in Pb-17Li<br />
1 . 10-11<br />
Knowledge of the hydrogen-isotope mass transfer parameters<br />
1<br />
in liquid metal is fundamental for the design of some tritium<br />
. 10-12<br />
processing systems, particularly the devices that extract tritium<br />
from Pb-17Li, which are based on the technology of gas-liquid 1 . 10-13<br />
contact equipment.<br />
1<br />
From previous experiments and theoretical considerations,<br />
. 10-14<br />
<strong>1.</strong>3 <strong>1.</strong>4<br />
diffusion in the gas phase is considered to be faster than<br />
transport phenomena through the bulk of the liquid, the liquid<br />
transition layer and the gas-liquid interface. However, identification of the<br />
controlling mechanism in the overall desorption kinetics is complex because it<br />
depends on several parameters, such as hydrodynamic conditions of the liquid-gas<br />
system, gas composition and liquid metal impurity content.<br />
The results achieved in the past by different techniques often disagree with each<br />
other and do not provide a clear understanding of the controlling transport step. The<br />
LEDI device at <strong>ENEA</strong> Brasimone is based on hydrogen/deuterium permeation<br />
through a thin layer of Pb-17Li, stagnant over a metallic membrane. This system<br />
seems to be more flexible as it is possible to vary the thickness of the liquid metal as<br />
well as the surface conditions, which can strongly affect the kinetics of the whole<br />
transport mechanism. First results with the LEDI device were obtained in the last<br />
part of 200<strong>1.</strong> Their analysis demonstrated that steady state was not perfectly reached<br />
due to some problems in maintaining high-vacuum conditions during long<br />
experiments. The device is now under modification to improve the accuracy of the<br />
next experiments.<br />
SOLE is an upgrade of LEDI and should provide direct measurement of the<br />
solubility of the hydrogen isotope in Li17Pb83 in the range 300-500°C. The design of<br />
SOLE was based on accurate theoretical modelling performed in co-operation with<br />
the Moscow Engineering Physics Institute (MEPHI). The solubility is determined by<br />
the amount of gas absorbed into the bulk of the liquid metal when the system is at<br />
the steady state.<br />
3.8.4 Hydrogen permeability and embrittlement in EUROFER97<br />
martensitic steel<br />
Hydrogen/deuterium permeation experiments performed in the past on<br />
EUROFER97 showed a non-negligible decrease in permeability with respect to other<br />
fusion-oriented martensitic steels. In 2001, experimental activities were focused on<br />
determining the hydrogen/deuterium transport parameters through aged<br />
EUROFER97 in the temperature range 423-723 K, by a time-dependant permeation<br />
technique, with a hydrogen or deuterium upstream pressure of about 75000 Pa. On<br />
the basis of experimental results, permeability, lattice diffusivity and Sieverts<br />
constant K s,l for deuterium in EUROFER97 are being processed.<br />
Mechanical tests were also done on hydrogen-charged specimens at room<br />
temperature to determine the threshold concentration of hydrogen for hydrogen<br />
embrittlement. Low strain-rate tensile tests were conducted on notched and smooth<br />
Φ (mol m-1s-1Pa-1/2)<br />
1 . 10-10<br />
500 450 400 350<br />
<strong>1.</strong>5<br />
<strong>1.</strong>6<br />
1000/T (1/K)<br />
<strong>1.</strong>7<br />
300<br />
Disk<br />
Reference T increase<br />
Reference T decrease<br />
HD T increase<br />
HD T decrease<br />
HD T increase 2<br />
HD gas phase<br />
<strong>1.</strong>8<br />
Fig. 3.30 - Arrenhius plot<br />
of HD-coated specimen<br />
permeabilities (gas and<br />
liquid metal phases).
3. FUSION TECHNOLOGY 93<br />
3.8 Liquid Metal Technology and<br />
Hydrogen Effects on Materials<br />
Fig. 3.31 - Area reduction<br />
as a function of hydrogen<br />
content at room and high<br />
temperature.<br />
Area reduction /Area red. virgin mat. (%)<br />
120<br />
100<br />
80<br />
60<br />
40<br />
20<br />
EUROFER steel<br />
T =20°C<br />
T =100°C<br />
T =200°C<br />
0<br />
0 1 2 3 4 5 6 7 8 9<br />
cylindrical<br />
specimens that had<br />
been previously<br />
electrochemically<br />
charged with<br />
hydrogen (contents<br />
of up to 3 wppm) at<br />
high temperature<br />
(90°). The experimental<br />
activities<br />
were performed in<br />
collaboration with<br />
the University of<br />
Pisa.<br />
Hydrogen content (wppm)<br />
As expected, the<br />
hydrogen concentration necessary to have a marked decrease in the area reduction<br />
coefficient was found to be quite high compared to that determined at room<br />
temperature (fig. 3.31).<br />
The experimental activity on hydrogen embrittlement will be completed during first<br />
months of 2002.<br />
3.8.5 Water detritiation systems (EU Task TTBA-D02)<br />
The aim is to assess a design to simplify the WCLL blanket concept by eliminating<br />
the TPBs on the double walled tubes of the primary cooling system and recovering a<br />
significant part of the bred tritium directly through the water detritiation system<br />
(WDS).<br />
From previous studies, it was found that this approach to tritium management<br />
strategy is feasible from a techno-economic point of view only if a steady-state<br />
tritium concentration of several Ci/kg is allowed in the primary cooling loops. In<br />
other words, the tritium specific activity in the primary cooling system must be a<br />
good deal higher than that foreseen in the reference design (1Ci/kg).<br />
A detailed safety analysis on the consequences of a relatively high tritium specific<br />
activity in the primary coolant was, therefore, performed in collaboration with the<br />
University of Bologna. The environmental tritium release was determined for an exvessel<br />
loss of coolant accident (LOCA) in normal operation. The tritium specific<br />
activity considered corresponded to the “economical optimum” for a water<br />
detritiation system, based on electrolysis, distillation columns + vapour phase<br />
catalytic exchange and combined electrolysis catalytic exchange (CECE), in all cases<br />
with a tritium permeation rate (TPR) of 10 g/day from the breeder into the coolant.<br />
Such a TPR corresponds to a PRF of 10 for the tritium permeation barriers. This value<br />
is achievable, in principle, only by using double walled EUROFER97 tubes with<br />
copper as brazing material. A water leak rate of 2 kg/h from the primary cooling<br />
circuit was assumed, with <strong>1.</strong>9 kg/h towards the steam generator vault and the<br />
remaining 0.1 kg/h into the secondary circuit through the steam generators.<br />
For an ex-vessel LOCA, even in the worst case, which corresponds to the highest<br />
enthalpy content of the cooling water, the environmental tritium release was<br />
determined to be much lower than the limit of 5 g of tritium in HTO form; this is the<br />
maximum acceptable value according to the ITER Guidelines for Environmental<br />
Tritium Release.
94<br />
3. FUSION TECHNOLOGY<br />
3.8 Liquid Metal Technology and<br />
Hydrogen Effects on Materials<br />
As for the tritium environmental release in normal operation (chronic release), a<br />
tritium specific activity of 9 Ci/kg was found to be acceptable, which is lower than<br />
the limit of 0.37 PBq/y (as<br />
recommended by the<br />
DEMO Safety Working<br />
Group). Of course, in this<br />
case a fundamental role is<br />
played by the tightness of<br />
the steam generator (0.1<br />
kg/h was the assumed<br />
water leakage toward the<br />
secondary circuit through<br />
the steam generator),<br />
which is a crucial issue.<br />
Figure 3.32 reports the<br />
chronic tritium release vs.<br />
TPR for different WDS<br />
technologies.<br />
3.8.6 Measurements of H/D diffusivity and solubility through<br />
tungsten and tungsten alloys in the range 600-800°C (ITER<br />
Task 436)<br />
The evaluation of hydrogen transport and solubility parameters in tungsten, which<br />
is one of the candidate<br />
materials for the ITER first<br />
wall was continued from<br />
Temperature (°C)<br />
2000 (see Progress Report<br />
838<br />
727<br />
1<br />
2000).<br />
. 10-12<br />
W-H 2 gas<br />
The experiments in 2001<br />
were performed with a<br />
hydrogen driving<br />
pressure of 105 Pa. The<br />
preliminary results in<br />
terms of permeability are<br />
in good agreement with<br />
the past results and with<br />
the literature data (see fig.<br />
3.33). Further experiments<br />
will be carried out during<br />
2002.<br />
Environmental tritium release (PBq/y)<br />
Φ (mol m-1s-1Pa-1/2)<br />
0.9<br />
0.8<br />
0.7<br />
0.6<br />
0.5<br />
0.4<br />
0.3<br />
0.2<br />
0.1<br />
0<br />
0 10 20 30 40<br />
Tritium permeation rate (g/day)<br />
1 . 10-13<br />
1 . 10-14<br />
tritium activity in the coolant at the<br />
optimum economical point<br />
Linear Fit PERI2<br />
PERI2<br />
Frauenfelder<br />
Serra<br />
Perujo<br />
0.95<br />
1<br />
<strong>1.</strong>05<br />
1000/T (1/K)<br />
ELECTROLYSIS<br />
DC+VPCE<br />
CECE<br />
ANNUAL LIMIT<br />
<strong>1.</strong>1<br />
<strong>1.</strong>15<br />
Fig. 3.32 - Chronic<br />
environmental tritium<br />
release vs. TPR for different<br />
WDS technologies.<br />
Fig. 3.33 - Arrenhius plot<br />
of tungsten permeability<br />
(experimental) compared<br />
with literature data.<br />
3.8.7 Corrosion and mechanical tests on structural materials in<br />
flowing Pb-17Li (EU Task TTMS-003-D13)<br />
This activity concerns corrosion rate evaluations and tensile tests on specimens of<br />
EUROFER97 steel pre-exposed in the LIFUS II loop to flowing Pb-17Li with a rate of<br />
0.6 l/h, at 480°C for up to 5000 h. Corrosion and tensile samples were extracted from<br />
the LIFUS II loop test section every 1500 h. Post-test weight-change measurements as<br />
well as metallurgical analysis were performed on the corrosion specimens to<br />
estimate the corrosion rate and to evaluate its mechanism. Tensile tests were done at<br />
480°C on the corroded tensile specimens to assess the mechanical properties of<br />
exposed steel.<br />
The weight change measurements showed that the steel has a linear trend of weight
3. FUSION TECHNOLOGY 95<br />
3.8 Liquid Metal Technology and<br />
Hydrogen Effects on Materials<br />
Fig. 3.34 - SEM-BSE<br />
micrograph of the cross<br />
section of the 4500-h<br />
tested sample.<br />
Fig. 3.35 - Tensile properties<br />
obtained at 480°C<br />
on EUROFER97 steels<br />
exposed to Pb–17Li.<br />
Tensile strength (N/mm2)<br />
Pb-Li<br />
500<br />
400<br />
300<br />
200<br />
100<br />
Corroded<br />
layer<br />
20 µm<br />
RM<br />
RP 0.2<br />
Z%<br />
80<br />
60<br />
40<br />
20<br />
0<br />
0 1000 2000 3000 4000 5000 0<br />
Reduction in area (%)<br />
loss with increasing exposure time.<br />
The corrosion rate of the steel,<br />
evaluated in the given experimental<br />
conditions, was 40 mm/y. This rate<br />
seems to be in agreement with the<br />
general trend of corrosion rates of<br />
ferritic-martensitic steels exposed to<br />
flowing Pb-17Li. The corrosion<br />
mechanism could be explained by<br />
considering that EUROFER97 steel<br />
suffers typical corrosive attack due<br />
to dissolution of the steel elements<br />
in the liquid metal. Figure 3.34<br />
shows the scanning electron<br />
microscopy (SEM) micrograph<br />
obtained with the back-scattered<br />
electron (BSE) detector on the cross<br />
section of the 4500-h tested samples.<br />
The figures show that a layer about<br />
1 mm thick seems to be detached<br />
from the surface of the steel. At the<br />
interface between the layer and the<br />
bulk material, voids can be seen,<br />
and energy-dispersion x-ray<br />
analysis showed that the quasidetached<br />
layer was Cr depleted.<br />
Exposure time in flowing Pb-17Li (h)<br />
With regard to the tensile<br />
properties, figure 3.35 reports the average yield strength, maximum strength and the<br />
area reduction obtained on sets of five specimens for each point are plotted vs.<br />
exposure time in flowing Pb-17Li. The plot shows that the exposure of the steel to the<br />
liquid metal did not affect its mechanical properties. The observed tensile behaviour<br />
confirms the results obtained in the past, that the mechanical properties of the<br />
ferritic-martensitic steels are unaffected by flowing liquid Pb-17Li.<br />
Simultaneously to the experimental campaign carried out on EUROFER97, LIFUS II<br />
was used for experiments on the effects of corrosion on tensile properties of<br />
SiC f /SiC. The first tests were conducted at 550°C for an exposure time of 100 h. The<br />
results are presently under evaluation.<br />
The activity should continue during 2002 through experimental campaigns with a<br />
longer exposure time.<br />
3.8.8 Interaction chemistry between Li 2<br />
TiO 3<br />
ceramic pebble bed<br />
and EUROFER97 in He + 0.1% H 2<br />
purge gas at 600°C<br />
The helium-cooled pebble bed (HCPB) blanket is one of the two concepts in the<br />
European Blanket Programme under development for testing in a next-step fusion<br />
machine. For this particular task, the interaction chemistry between EUROFER97<br />
and the Li 2 TiO 3 ceramic breeder pebble bed in flowing He + 0.1% H 2 was studied.<br />
Experimental data were obtained, for up to 200 h of exposure time, by using a<br />
thermo-balance with a controlled flow gas of 80 scmc/min and a water content of<br />
less than 20 ppm at the start. For an exposure time of between 500 and 2000 h, a<br />
flanged alumina tube was set in a horizontal oven with a controlled flow gas of 80<br />
scmc/min, in case the water content was verified to be less than 50 ppm at the start.
96<br />
3. FUSION TECHNOLOGY<br />
3.8 Liquid Metal Technology and<br />
Hydrogen Effects on Materials<br />
Weight change data were calculated and reported in a parabolic diagram. Two<br />
different parabolic rate constants that had similar values for the two different<br />
systems were obtained, indicating a self-limiting mechanism due to a diffusioncontrolled<br />
step of the reacting species. In this case, the system studied can basically<br />
be regarded as the oxidation of metals due to possibility of the presence of lithium.<br />
Moreover, the chromium content in the alloy is sufficient to promote the formation<br />
of a chromium oxide layer able to protect the metal from further oxidation. In any<br />
case, the two kinetics are basically identical due to the water-production rate, which<br />
is determined by temperature, and both the parabolic rate constants fall within the<br />
range reported in the literature.<br />
Oxidation proceeds with time from<br />
areas under the pebbles in contact with<br />
the metal surface (fig. 3.36), up to<br />
almost the entire surface after 2000 h,<br />
when an oxide layer not exceeding 2<br />
µm anywhere is observed. Under the<br />
pebbles, the metal surface shows cracks<br />
with a maximum depth of about 4 µm<br />
(fig 3.37). It is not clear whether the<br />
mechanism proceeds via the oxygen<br />
that enters the metal or whether the<br />
chromium diffuses outward or, more<br />
probably, both.<br />
X-ray diffraction analysis (XRD)<br />
showed the absence of lithium<br />
compounds and the presence of only<br />
oxides (Cr,Fe) 2 O 3 and (Fe,Cr) 3 O 4 , with<br />
iron and chromium present as minor<br />
elements in the first and second case,<br />
respectively.<br />
Fig. 3.36 – Scattered<br />
electron image at 20X of<br />
EUROFER97 specimen<br />
exposed for 1000 h in<br />
Li 2 TiO 3 pebble bed.<br />
Fig. 3.37 – Backscattered<br />
cross-section<br />
image at 2500X.<br />
Considering the thermodynamic conditions and the oxygen chemical potential, the<br />
temperature of 600°C seems to be borderline for (Cr,Fe) 2 O 3 .<br />
3.8.9 Li 2<br />
TiO 3<br />
pebble reprocessing; recovery of 6 Li as Li 2<br />
CO 3<br />
Lithium titanate is one of the most promising candidates for tritium breeding. The<br />
temperature of tritium release from polycrystalline Li 2 TiO 3 ceramic pellets and<br />
pebbles was found to be lower than from many other Li ceramics. This material also<br />
shows good chemical stability in air and has acceptable mechanical strength.<br />
A process for obtaining Li 2 CO 3 from Li 2 TiO 3 sintered pebbles by wet chemistry was<br />
developed. This is considered useful in view of the recovery of the 6Li isotope from<br />
lithium titanate breeder burned to its end of life in a fusion reactor. The process was<br />
optimised with respect to the chemical attack of titanate by using an aqueous HNO 3<br />
solution. The subsequent precipitation of lithium carbonate by Na 2 CO 3 produced a<br />
powder with chemical and morphological characteristics suitable for its reexploitation<br />
in the fabrication of Li 2 TiO 3 pebbles. Reprocessing was also planned to<br />
adjust the 6 Li concentration to the desired value by using 6 Li-enriched LiOH*H 2 O<br />
and to obtain its homogeneous distribution in the powder batch.<br />
A specific procedure was used to add a number of small carbonate batches (each one<br />
obtained from 40 g of starting pebbles) in order to produce a batch of about 400 g of
3. FUSION TECHNOLOGY 97<br />
3.8 Liquid Metal Technology and<br />
Hydrogen Effects on Materials<br />
lithium carbonate (named LC-RT518). The XRD pattern of the final LC-RT518 was in<br />
accordance with the ASTM JCPDS-831454 standards for monoclinic Li 2 CO 3 .<br />
Table 3.IV - Comparison of <strong>ENEA</strong> lithium<br />
carbonate and CEA carbonate sample<br />
Li 2 CO 3 main CEA <strong>ENEA</strong><br />
characteristics sample LC-RT518<br />
Bed density (g/cm 3 ) 0.56 0.45<br />
True density (g/cm 3 ) 2.07 2.06<br />
evaluated closed por. % 2.1 2.2<br />
Spec. Surface area (m 2 /g) 0.90 0.97<br />
Equival. Spher. Dia. (µm) 3.2 3.0<br />
Some further characterisations<br />
were performed on the final LC-<br />
518 carbonate batch, such as true<br />
density by He picnometry, and<br />
specific surface area by nitrogen<br />
adsorption through the classical<br />
three-point Brunauer-Emitt-Teller<br />
(BET) method. The results,<br />
reported in table 3.IV, were<br />
compared with parallel<br />
measurements on a reference<br />
carbonate sample from CEA.<br />
[3.43] P. Lorenzetto,<br />
Technical specification<br />
for the thermal fatigue<br />
tests of Be protected<br />
EDA mock-ups, EFDA<br />
/00-529, 19-11-2001<br />
Fig. 3.38 -Mockup frame<br />
in EDA-BETA.<br />
Fig. 3.39 - CFC electric<br />
radiative resistor.<br />
3.9 Thermal-Fluidodynamics<br />
3.9.1 Fatigue tests on six mockups of primary first-wall panel<br />
prototype (EFDA Contracts 00/529 and 00/533)<br />
The thermal fatigue testing of the first-wall components, i.e., six primary first-wall<br />
mockups (EDA) and two panels, has been committed to <strong>ENEA</strong> [3.43]. The objective<br />
is to perform thermal fatigue on beryllium armoured first-wall test sections. The<br />
experimental campaigns will be performed at <strong>ENEA</strong> Brasimone at the CEF 1-2<br />
thermal-hydraulic facility. For each test campaign, pairs of mockups or panels, to be<br />
tested in parallel, are assembled inside two special vacuum vessels called EDA-BETA<br />
(fig. 3.38) and THESIS. Special CFC electric radiative resistors (fig. 3.39) placed<br />
between each pair of facing mockups provide heating at a nominal heat flux of 0.8<br />
MW/m 2 with a period of 300 s. During the dwell phase, the fatigue stresses are<br />
magnified by inlet cooling water<br />
temperature from 120 to 20 °C.<br />
During the tests, the thermalhydraulic<br />
parameters (coolant,<br />
heater and material<br />
temperatures, water flow rate<br />
and pressure) are also measured.<br />
In 2001, the EDA-BEDA vacuum<br />
chamber was appropriately<br />
modified to provide the mockup<br />
cooling and the electrical<br />
feedthroughs. Preliminary<br />
testing of the modified EDA-<br />
BETA facility was also<br />
performed. Six mockups were<br />
delivered to <strong>ENEA</strong> Brasimone.<br />
They are armoured with Be<br />
grade S65C tiles with different<br />
dimensions and thickness (5 or<br />
10 mm). The heatsink is made of<br />
DS-Cu (Glidcop-Al25) joined to a<br />
stainless steel (AISI316 L) back<br />
plate, both provided with water<br />
cooling channels. At the end of
98<br />
3. FUSION TECHNOLOGY<br />
3.9 Thermal-Fluidodynamics<br />
2001, the first experimental campaign started on four of the EDA mockups mounted<br />
inside EDA-BETA [3.44, 3.45].<br />
3.9.2 HE-FUS3 experimental cassette of lithium-beryllium pebble<br />
beds<br />
During 2001, a new thermal test campaign was started on the HELICHETTA solidbreeder<br />
mockup. The objective of the tests on a single prismatic cell filled with the<br />
reference breeder Li 4 SiO 4 and Li 2 TiO 3 pebble beds was to determine the influence<br />
of the filling factor on the thermal-mechanical parameters and the behaviour of the<br />
ceramic bed after mechanical pre-cycling and application of the spring-system lateral<br />
load. From July 2001 to the end of the year, 60 tests were carried out in air on the<br />
HEFUS-3 facility at <strong>ENEA</strong> Brasimone on both the reference materials. The measured<br />
Li 4 SiO 4 and Li 2 TiO 3 pebble packing factors were, respectively, 0.65 and 0.64. The<br />
results of the first HELICHETTA test campaigns are:<br />
i) the displacement of the beds is as large as 0.2 mm towards the cooling plates and<br />
ranges from 0.5 to 1 mm for L i 2TiO 3 and up to <strong>1.</strong>5 mm for Li 4 SiO 4 towards the<br />
sliding plug;<br />
ii) the washer springs and sliding plug systems prevent larger stresses on the<br />
containment structure;<br />
iii) the pebble bed thermal conductivities in air show good agreement with previous<br />
FZK experiments;<br />
iv) the pebble thermal mechanical hysteresis, well evident during the cyclic ramp<br />
up/down tests, affects the thermal-mechanical bed behaviour.<br />
The tender for construction of both HELICA and HEXCALIBER was launched in<br />
December 2001 and their fabrication will be finished, respectively, by June 2002 and<br />
December 2002 [3.46, 3.47].<br />
3.10 International Fusion Material<br />
Irradiation Facility (IFMIF)<br />
3.10.1 Design and mockup tests of lithium jet target<br />
One of the main tasks of the lithium target design is to guarantee the jet stability<br />
against overheating by the powerful deuteron beam. This is achieved with the use<br />
of a curved plate (backplate) on which lithium flows. A computer code (RIGEL)<br />
developed ad hoc by <strong>ENEA</strong> Bologna was used to determine the best working<br />
conditions (table 3.V) for the new IFMIF design parameters (Reduced Cost Design).<br />
[3.44] G. Dell’Orco et al.,<br />
Status of the Contracts<br />
EFDA 00/529 and<br />
00/533 for the thermal<br />
fatigue tests of Be<br />
protected EDA – PFW<br />
mock-ups, <strong>ENEA</strong>-EFDA<br />
Meeting (Brasimone<br />
2001)<br />
[3.45] G. Dell’Orco et al.,<br />
Report for the Task<br />
T216+, subtask E1, on the<br />
thermal fatigue tests of<br />
Be protected first wall<br />
mock-ups, <strong>ENEA</strong> Internal<br />
Report, SB-G-R-0051<br />
(2001)<br />
[3.46] G. Dell’Orco et al.,<br />
TAZZA mock-up pebble<br />
beds - Experimental and<br />
theoretical investigations,<br />
presented at the<br />
10th Int. Workshop on<br />
Ceramic Breeder Blanket<br />
Interactions (CCBI-10)<br />
(Karlsruhe 2001)<br />
[3.47] G. Dell’Orco et al.,<br />
Progress on pebble bed<br />
experimental activity for<br />
the HE-FUS3 mock-ups,<br />
presented at the 10th<br />
Int. Workshop on<br />
Ceramic Breeder Blanket<br />
Interactions (CCBI-10)<br />
(Karlsruhe 2001)<br />
Tab 3.V - IFMIF target input data and Li jet stability results<br />
Main input data<br />
r<br />
Main results<br />
Beam footprint 5×20 [cm×cm] Reynolds number 694417 [-]<br />
Jet thickness 0.025 [m] Max. pressure 12493 [Pa]<br />
Jet width 0.26 [m] Max. surface temperature 297 [°C]<br />
Jet velocity 15 [m/s] Max. temperature in the 441 [°C]<br />
bulk<br />
Backplate curvature 0.25 [m] Min. free surface boiling 35 [°C]<br />
radius<br />
margin<br />
Inlet temperature 250 [°C] Min. bulk boiling margin 403 [°C]<br />
Jet power deposition 10 [MW] Free surface evaporation 16 [g/year]
3. FUSION TECHNOLOGY 99<br />
3.10 International Fusion Material<br />
Irradiation Facility (IFMIF)<br />
Fig. 3.40 - Boiling margins<br />
for two values of<br />
curvature radius R.<br />
800<br />
The results show that, for a 10-<br />
MW beam power, the Li<br />
700<br />
surface temperature at the jet<br />
outlet increases by about<br />
600<br />
50°C, and the corresponding<br />
boiling margin is 35°C. That<br />
500<br />
is, the jet is thermally stable<br />
against up to a 70% increase in<br />
400 R = 250 cm<br />
R = 474 cm<br />
beam power. The jet bulk<br />
stability is even better.<br />
300<br />
0 5 10 15 20 25<br />
Furthermore, calculations<br />
demonstrate that the boiling<br />
Distance from lithium jet free surface (mm)<br />
margins in the bulk do not<br />
change appreciably by changing the curvature radius, as shown in figure 3.40.<br />
Temperature (°C)<br />
During 2001, <strong>ENEA</strong> started a co-operation with JAERI to monitor the lithium<br />
experimental facility at OSAKA University against the risk of cavitation. The<br />
cavitation noises will be detected by specific instruments and analysed by <strong>ENEA</strong><br />
CASBA equipment mounted on the existing pipe lines.<br />
The experiments consist of a water jet mockup simulating the lithium jet. The jet will<br />
flow through a double nozzle on a curved target back plate. The nozzle was designed<br />
by means of the correlations derived from the Shima model. The design of the water<br />
mockup assures some flexibility in selecting the target curvatures (250-450 mm), the<br />
precision of the joint between the nozzle and the target back plate (± 0.1 mm, for a<br />
total of five intermediate positions) and its surface roughness (1-10 mm).<br />
Fig. 3.41 - General view of<br />
the IFMIF target<br />
assembly.<br />
It has been established that a replaceable backplate is the optimal solution for the<br />
IFMIF target design. This solution has been further developed into the so-called<br />
bayonet concept in which the backplate is supported in a<br />
sliding holder integrated with the target assembly<br />
structure. This target concept facilitates removal and<br />
installation operations when the backplate has to be<br />
replaced, and they can be carried out without removal of<br />
Backplate the test assembly. Figure 3.41 shows a general view of the<br />
3-D model of the target assembly. The DRP facility at<br />
<strong>ENEA</strong> Brasimone is suitable for the feasibility trials of the<br />
remote handling operations needed to replace the IFMIF<br />
back-plate.<br />
Heavy manipulator<br />
Support frame<br />
Besides the design activities, a review of on-line methods<br />
for impurity control and measurements in liquid Li was<br />
performed in collaboration with the University of<br />
Nottingham, UK to measure the corrosion rate on the<br />
reference structural materials in well-defined testing<br />
conditions.<br />
3.10.2 System safety analysis and shielding calculations<br />
Analyses of the safety of the lithium target and loop as well as shielding calculations<br />
and a safety review of the whole IFMIF plant are in progress.<br />
The failure mode and effect analysis (FMEA) approach was used to assess the<br />
hazards related to the lithium-target operation. The main conclusions are that the<br />
target of the reduced-cost plant fulfils the safety requirements with a negligible
100<br />
3. FUSION TECHNOLOGY<br />
3.10 International Fusion Material<br />
Irradiation Facility (IFMIF)<br />
environmental impact. Calculations with the RELAP5 Mod 3.2 code were performed<br />
for the thermal transient analysis of the lithium loop, both in operational and in<br />
accident conditions. The results show that IFMIF has good thermal-hydraulic<br />
stability and a good agreement with the specified conditions for the facility at 10<br />
MW. The study also pointed out that the hazards related to the accelerator are<br />
confined within the plant boundaries, and concern mostly operator exposure to the<br />
radiation induced by accelerator operation.<br />
The IFMIF conceptual design was reviewed with regard to occupational radiation<br />
exposure. After careful assessment and analysis of the doses associated with the<br />
TRIUMF 520 MeV accelerator, it was concluded that the collective worker doses<br />
could be relatively high.<br />
Several key issues were identified and discussed to find possible solutions.<br />
International radiation protection practices as well as the as-low-as-reasonably<br />
achievable (ALARA) requirements were examined. The ALARA optimisation<br />
process identifies the design improvements that could be made at a reasonable cost.<br />
Reasonable cost is judged on the basis of the financial expenditure required to<br />
achieve a unit reduction in dose. At an estimated facility dose of 1800 p-mSv/a (12<br />
mSv/a is the average worker dose), IFMIF is way above current operating<br />
experience.<br />
With regard to the shielding and activation calculations in 2001, new computational<br />
tools and data libraries were developed to define and establish design criteria and to<br />
assess the radiological protection related to IFMIF beam-on and beam-off operational<br />
phases.<br />
A new intermediate energy coupled 256-neutron and 49 gamma-ray multi-group<br />
cross-section library Vitenea-IEF, containing data for 37 materials/isotopes, was<br />
produced. It was obtained by processing the evaluated files of the ENDF/B-VI<br />
release 6 and the FZK nuclear data via the Njoy-Smiler-Ampx code systems. A new<br />
file, containing the group-wise neutron and gamma fluence to ambient dose<br />
equivalent conversion factors was developed for the dose-rate calculations.<br />
Application tests to check the Vitenea-IEF library via the Scale-<strong>ENEA</strong> shielding<br />
analysis sequence are in progress on the IFMIF configurations. A new activation code<br />
package (Anita-IEAF) based on the Anita-2000 code (NEA-1638, RSICC CCC-606)<br />
was developed to handle the numerous reaction channels for neutron energies over<br />
20 MeV. The upgrade of the Anita code to let it manage the many reaction channels<br />
now available in the activation library is in progress. Preliminary application tests of<br />
the Anita-IEAF activation library are being performed for activation analysis of the<br />
IFMIF test cell materials.<br />
3.10.3 Development of fast neutron diagnostics<br />
Work continued on the development of the IFMIF miniaturised (<strong>1.</strong>5 mm diameter)<br />
fast on-line neutron monitors. Three prototype miniaturised fission chambers were<br />
produced by CEA Cadarache in 2001: two chambers with fissile materials (237Np<br />
and 238U) and one without fissile coating. These detectors, successfully tested at the<br />
MINERVE thermal reactor at CEA, will be irradiated during 2002 at the cyclotronbased<br />
Fast Neutron Facility (FNF) of the Nuclear Physics Institute, Rez (Czech<br />
Republic). To produce an IFMIF-like neutron spectrum, the p(35 MeV)+D2O reaction<br />
will be used as a source of high-energy neutrons. Although the technology for the<br />
construction of the <strong>1.</strong>5-mm-diam fission chambers foreseen for IFMIF is already<br />
available, it was decided to build prototype fission chambers with larger diameter (8<br />
mm) so that a sufficient signal level can be detected with the low neutron flux<br />
(~3×10 12 n/s/sterad) provided by the cyclotron.
3. FUSION TECHNOLOGY 101<br />
3.10 International Fusion Material<br />
Irradiation Facility (IFMIF)<br />
[3.48] S. Tosti et al.,<br />
Testing of a catalytic<br />
membrane reactor (CMR)<br />
for decomposition of<br />
tritiated water from<br />
breeder blanket purge<br />
gas in a closed loop pilot<br />
plant, <strong>ENEA</strong> Internal<br />
Report FUS TN BB-TS-<br />
R-003 (2001)<br />
[3.49] S. Tosti et al., Fus.<br />
Eng. Des. 49–50, 953<br />
(2000)<br />
[3.50] S. Tosti et al,<br />
Method of bonding thin<br />
foils made of metal alloys<br />
selectively permeable to<br />
hydrogen, particularly<br />
providing membrane<br />
devices, and apparatus<br />
for carrying out the<br />
same, European Patent EP<br />
1184125 A1 (2001)<br />
[3.51] S. Tosti et al., Pd-<br />
Ag membrane reactors<br />
for water gas shift<br />
reaction, to be published<br />
in Chem. Eng. J.<br />
[3.52] A. Basile et al,<br />
Sep. Purif. Technol. 25,<br />
549 (2001)<br />
[3.53] S. Tosti et al.,<br />
Characterization of thin<br />
wall Pd-Ag rolled<br />
membranes, to be<br />
published in Int. J.<br />
Hydrogen Energy Science<br />
Fig. 3.42 - Measured<br />
conversion values for the<br />
water gas-shift reaction.<br />
Two data acquisition systems for the tests at the cyclotron were developed at <strong>ENEA</strong><br />
Frascati: a) pulse mode based on a PCI card and LabVIEW software, with inputs for<br />
8 channels and counting frequency up to 10 MHz; b) current mode based on CAMAC<br />
modules and LabVIEW software. The neutron code SAND-II (for analysis of the<br />
neutron activation data taken in the irradiation experiment) was implemented.<br />
3.1<strong>1.</strong>1 Tritium recovery from tritiated water<br />
3.11 Fuel Cycle<br />
The activities carried out concern the development, production, and testing of rolled<br />
Pd-ceramic membranes and membrane reactors for the water gas-shift reaction<br />
[3.48].<br />
A pilot plant for testing membranes and membrane reactors in operating conditions<br />
relevant to a “closed loop process” [3.49] for tritium recovery from tritiated water<br />
was assembled.<br />
The Pd-Ag rolled sheets were used to fabricate permeator tubes by a new welding<br />
procedure. This new technique, an alternative to the inert gas tungsten arc welding<br />
previously used, avoids the formation of thermal stressed zones along the permeator<br />
tubes [3.50]. The rolled membranes were tested at 135-360°C with a hydrogen<br />
transmembrane pressure in the range of 130-180 kPa and hydrogen flow rates up to<br />
<strong>1.</strong>02×10 -4 mol s -1 . Complete hydrogen selectivity and good chemical and physical<br />
stability were observed in long-term tests. The membrane reactors were tested at 325-<br />
330°C, with a feed pressure of 100 kPa with reference to the water gas-shift reaction<br />
CO+H 2 O⇔H 2 O+CO 2 .<br />
High reaction conversion values in the range 95-99% (above the equilibrium value,<br />
about 80%) for the water gas-shift reaction were measured, and the effects of the flow<br />
rate and excess water in the feed stream were evaluated [3.51, 3.52]. The excess water<br />
in the feed flow rate produces an increase in the reaction yield, according to the<br />
theoretical analyses. Figure 3.42 reports three cases:<br />
• equimolar feed ratio (CO=H 2 O);<br />
• excess water (H 2 O=0.6, CO=0.4);<br />
• excess water and the presence of a reaction product (H 2 O=0.3, CO=0.5, CO 2 =0.5).<br />
The tests on the membrane reactors have demonstrated the applicability of<br />
membrane technologies for the decomposition of tritiated water from breeder<br />
blanket purge gas as well as for hydrogenation or dehydrogenation processes<br />
involving the use or<br />
Reaction conversion (%)<br />
99<br />
98<br />
97<br />
96<br />
95<br />
0<br />
CO=H 2 O=0.5<br />
CO=0.4 H 2 O=0.6<br />
CO=0.2 H 2 O=0.3 CO 2 =0.5<br />
4 . 10-5 8 . 10-5 <strong>1.</strong>10-4<br />
CO feed flow rate (mol/s)<br />
production of extremely<br />
pure hydrogen.<br />
In addition, the effect of<br />
contaminants on the<br />
interaction of hydrogen<br />
gas with palladium and<br />
the modification of the<br />
membrane surface were<br />
studied by characterising<br />
the Pd-Ag rolled<br />
membranes in long-term<br />
tests [3.53].
102<br />
3. FUSION TECHNOLOGY<br />
3.12 Safety and Environment, Power<br />
Plant Studies and Socio-Economics<br />
3.12.1 Occupational radiation exposure assessment for ITER-FEAT<br />
The first occupational radiation exposure (ORE) analysis for ITER-FEAT was<br />
completed during 2001 [3.54]. The collective dose results provided in the previous<br />
analysis were reviewed, and the final assessment was completed regarding hands-on<br />
activities for maintaining, inspecting and/or replacing the following items:<br />
blanket/limiter, electron cyclotron heating system, ion cyclotron heating system,<br />
cryopumps, divertor cassettes, three loops of the tokamak cooling water system<br />
(TCWS). Airborne tritium was also considered, together with the other radiological<br />
sources already included in the previous study (neutron activation due to plasma<br />
burning, activated corrosion products on the inner surface of the TCWS pipes and<br />
components).<br />
The collective dose results are: for the hands-on assistance activities at the tokamak<br />
ports, 197 person-mSv/y; for the five loops of the TCWS (first-wall blanket, divertor<br />
and neutron-beam injector), 105 person-mSv/y, about 21 person-mSv/y per loop<br />
[3.55 (Vol VI)].<br />
3.12.2 Validation of computer codes and models (EFDA Task SEA5)<br />
Several simulation codes are used for the ITER safety analyses. The codes for treating<br />
thermal-hydraulic phenomena, aerosol and neutron transport, materials activation<br />
and the generation of activated corrosion products are validated by comparing them<br />
with experimental results and codes already validated, by means of benchmarks.<br />
Thermal-hydraulic phenomena<br />
To validate the thermal-hydraulic computer codes, calculations were performed<br />
[3.56] against a set of five experimental cases of loss of coolant in volumes at subatmospheric<br />
pressure in the Inlet of Coolant Events (ICE) facility at the JAERI<br />
laboratories in Japan. A further check was performed [3.57], [3.58] against a second<br />
set of four test cases, to verify the behaviour of the codes in condensation and<br />
evaporation phases. The codes involved in the campaign were the ISAS system<br />
(linking ATHENA, for thermal-hydraulic transients, and INTRA, for containment<br />
simulations) and the fast running code CONSEN. The comparison between blindtest,<br />
experimental and post-test results was examined in detail to point out the main<br />
differences.<br />
The peak of pressure in the plasma chamber (figs. 3.43 and 3.44) and vacuum vessel,<br />
the most important outcome of the accident analyses, is quite well matched in the<br />
post-test calculations by both ISAS and CONSEN. In all the cases, they showed a<br />
maximum deviation from the experiments within the range of 5%.<br />
The overall results indicate the high accuracy of the ISAS tool in coupling the<br />
different codes for accident analyses. CONSEN proved to be flexible and also<br />
suitable in two-phase flow<br />
conditions. Both the simulation<br />
tools can be considered adequate<br />
for the thermal-hydraulic<br />
applications requested.<br />
CONSEN [3.59] was also<br />
implemented for validation<br />
against the results of the French<br />
EVITA facility (built by CEA,<br />
Cadarache), with the same<br />
satisfactory results.<br />
Pressure (kPa)<br />
700<br />
600<br />
500<br />
400<br />
300<br />
200<br />
100<br />
Exper<br />
Post<br />
Pre<br />
0<br />
0 50 100 150 200<br />
Time (s)<br />
[3.55] ITER Generic Site<br />
Safety Report, ITER<br />
JCT (2001)<br />
[3.56] M.T. Porfiri, P.<br />
Meloni, ISAS post test<br />
calculation for inlet of<br />
coolant experiments,<br />
FUS-TN-SA-SE-R-006<br />
(2001)<br />
[3.54] S. Sandri, EU<br />
Task TW0-SEA2:<br />
Personnel Safety ITER<br />
Task No. G81TD10FE<br />
(D453), FUS-TN-SA-<br />
SE-R-013 (2001)<br />
[3.57] M.T. Porfiri, P.<br />
Meloni ISAS calculations<br />
for inlet of coolant<br />
(ICE) experiments in<br />
2001: pre and post-tests<br />
2a, 2b, 6 and 7, FUS-TN-<br />
SA-SE-R-031 (2001)<br />
[3.58] G. Caruso, M.T.<br />
Porfiri,“CONSEN validation<br />
against ICE –<br />
Experimental campaign<br />
2001 - Post-test calculations<br />
for the cases 2a,<br />
2b, 6 and 7-Post-test<br />
calculations for the<br />
cases 2a, 2b, 6 and 7,<br />
FUS-TN-SA-SE-R-032<br />
(2001)<br />
[3.59] G. Caruso, M.T.<br />
Porfiri, “CONSEN validation<br />
against EVITA -<br />
Experimental campaign<br />
2001 - Post-test calculations”,<br />
FUS-TN-SA-SE-<br />
R-033 (2001)<br />
Fig. 3.43 – Plasma<br />
chamber pressure for ICE<br />
case 6 (CONSEN).
3. FUSION TECHNOLOGY 103<br />
3.12 Safety and Environment, Power<br />
Plant Studies and Socio-Economics<br />
800<br />
Neutron transport and materials activation<br />
Pressure (kPa)<br />
600<br />
400<br />
200<br />
ISAS pre-test<br />
Experiment<br />
ISAS post-test<br />
The code package updating, completed in November<br />
2000, was released to the OECD-NEA Data Bank.<br />
Validation of the ANITA-2000 code package continued<br />
[3.60, 3.61] by comparing calculations with the<br />
experiments performed at the Fusion Neutronics Source<br />
(FNS), JAERI, Tokai, Japan.<br />
0<br />
0 20 40 60 80 100<br />
Time (s)<br />
Fig. 3.44 – Plasma chamber pressure for ICE case<br />
7 (ISAS).<br />
The material samples were irradiated by a 14-MeV<br />
neutron flux in two series lasting 5 min and 7 h,<br />
respectively. The neutron energy spectrum and neutron<br />
source intensity of the experimental irradiation, as well as<br />
the sample compositions, were provided by JAERI. A 175<br />
energy-level neutron flux distribution was considered.<br />
[3.60] D.G. Cepraga, G.<br />
Cambi, M. Frisoni,<br />
ANITA-2000 activation<br />
code package. Part II :<br />
code validation, <strong>ENEA</strong><br />
FUS-TN-SA-SE-R-020<br />
(2001)<br />
[3.61] D.G. Cepraga et al.,<br />
Decay heat estimate for<br />
fusion relevant materials<br />
based on EAF-99 and<br />
FENDL/A-2 libraries in<br />
comparison with FNS-<br />
Jaeri experiments, EFF-<br />
DOC-797, EFF/EAF<br />
Monitoring Meeting,<br />
NEA-OECD (Paris 2001)<br />
The European Activation File EAF99, the Fusion Evaluated Nuclear Data Library<br />
FENDL/A-2) and the decay data library for fusion applications FENDL/D-2 were<br />
used.<br />
Tables 3.VI and 3.VII summarise the experiment-calculation comparison, by range of<br />
discrepancies, for the 5-m and the 7-h irradiation scenarios, respectively, and for both<br />
activation libraries.<br />
As a general conclusion, it can be observed that, for the experimental irradiation<br />
scenario analysed, EAF99 generally provides a better agreement with the experiment<br />
than FENDL/A-2.<br />
Table 3.VI - Summary of calculation-experiment comparison (C-E)/E for<br />
samples irradiated for 5 min.<br />
(C-E)/E EAF99 FENDL/A-2<br />
50 % B4C, BaCO 3 , Bi, Cr, Na 2 CO 3 , B4C, BaCO 3 , Bi, CaO, Cr,<br />
SiO 2 , Y2O 3 Na 2 CO 3 , SiO 2 , Ta, Y2O 3<br />
Table 3.VII - Summary of calculation-experiment comparison (C-E)/E for<br />
samples irradiated for 7 h<br />
(C-E)/E EAF99 FENDL/A-2<br />
< 10% Co,Mn, Nb, NiCr, Ni, Re, S, SrCO 3 , Co, Mn, Nb, NiCr, Ni, Re, S, SrCO 3 ,<br />
SS-304, Ti, Zr, Inconel, SS-316 SS-304, Ti, Zr, Inconel, SS-316<br />
10 to 50<br />
%<br />
BaCO 3 , CaO, Fe, Mo, Na 2 CO 3 ,<br />
SnO2, Ta, V,Y 2 O 3 , Cu<br />
BaCO 3 , CaO, Fe, Mo, Na 2 CO 3 ,<br />
SnO 2 , V, Y 2 O 3 , Cu<br />
> 50 % Al, Bi, Cr, K 2 CO 3 , Pb Al, Bi, Cr, K 2 CO 3 , Pb, Ta
104<br />
3. FUSION TECHNOLOGY<br />
3.12 Safety and Environment, Power<br />
Plant Studies and Socio-Economics<br />
Activated corrosion products<br />
The experimental corrosion tests carried out by CEA with the CORELE2 facility were<br />
simulated by <strong>ENEA</strong> to validate the PACTITER code. The aim of the corrosion tests<br />
was to determine the 316L(N)-IG stainless-steel release rates in the thermalhydraulics<br />
and chemistry conditions envisaged for the ITER TCWS. The tubes for the<br />
corrosion tests in the CORELE2 loop were irradiated in the OSIRIS reactor. Pre-test<br />
calculations were carried out before the corrosion tests. The model also simulated the<br />
irradiation of the tube by assuming a decay period equal to 110 days. The four<br />
corrosion tests, assumed to last 10 days each, were simulated at temperatures of 100<br />
and 150°C and coolant velocities of 1 and 5 m/s. The pre-test calculations gave good<br />
results [3.62]. A simulation with the ANITA activation code confirmed that the results<br />
were satisfactory.<br />
Preliminary results of the experiments were made available in October 200<strong>1.</strong> A<br />
problem in the PACTITER code related to element solubility at low temperature was<br />
solved. The four corrosion tests were simulated using the modified PACTITER<br />
version: for test 2 (150 °C and 5 m/s), a stainless-steel release rate of 35<br />
mg/dm 2 /month was obtained. The release rates computed increased in conditions<br />
of higher temperature and coolant velocity [3.63].<br />
3.12.3 Plant safety assessment for ITER-FEAT<br />
The following activities were performed in contribution to the ITER Generic Site<br />
Safety Report (GSSR) [3.55].<br />
Activation calculation support for safety analysis<br />
The radiation transport and activation calculations were carried out as support to the<br />
safety analyses. The activation calculation results [3.64] include the specific activity,<br />
decay heat, contact dose, clearance index, list of isotopes at shutdown and dominant<br />
isotopes vs. cooling time up to 1x10 6 years, for each material and all the ITER radial<br />
zones. The nuclear heating of each zone was also obtained.<br />
Uncertainty analyses related to the activation characteristics of relevant ITER invessel<br />
components/materials were also carried out [3.65, 3.55 (Vol. III), 3.55 (Vol. V)].<br />
The uncertainties were obtained with the use of the Fispact-99 code and based on the<br />
nuclear activation data libraries EAF-99. Both cross-section and decay data errors<br />
were taken into account. Calculations were performed for:<br />
• First-wall heatsink outboard (Zone 39 – FWCUO): Cu and SS316;<br />
• Back of blanket outboard (Zone 55 – BLBKO): SS316;<br />
• Vacuum vessel front-wall outboard (Zone 56 – VVFWO): SS316.<br />
[3.62] L. Di Pace, D.G.<br />
Cepraga, CORELE 2 Pretest<br />
calculations, <strong>ENEA</strong><br />
FUS-TN-SA-SE-R-011<br />
(2001)<br />
[3.63] L. Di Pace, D. G.<br />
Cepraga, CORELE 2 Posttest<br />
PACTITER calculations,<br />
in preparation<br />
[3.64] G. Cambi et al.,<br />
“Anita-2000 activation<br />
code package: clearance<br />
assessment of ITER<br />
activated materials”, in<br />
preparation<br />
[3.65] D.G. Cepraga et al.,<br />
“Radiation transport and<br />
activation calculation for<br />
ITER GSSR: analysis<br />
updates”, <strong>ENEA</strong> FUS TN<br />
SA-SE-R 05A (2001)<br />
[3.66] D.G. Cepraga et al.<br />
“Impact of special<br />
impurities on the ITER<br />
outboard vacuum vessel<br />
activation”, <strong>ENEA</strong> FUS<br />
TN SA-SE-R 05B (2001)<br />
Table 3.VIII shows the results related to zone 39 – FWCUO.<br />
In addition, the impact of 1 to 10 ppm each of actinide and rare-earth impurities<br />
(dysprosium, holmium, thorium and uranium) on clearance of the outboard<br />
vacuum-vessel steel, plasma side and rear side was assessed [3.66].<br />
Table 3.VIII – Uncertainty in first-wall outboard activities at plasma shutdown (SA1 operational scenario)<br />
FW heatsink outboard (Cu)<br />
FW heatsink outboard (SS316)<br />
Isotope Activity [GBq/m 3 ] Uncertainty [%] isotope Activity [GBq/m 3 ] Uncertainty [%]<br />
Total 2.93×10 09 3.4 Total 5.34×10 08 4.71
3. FUSION TECHNOLOGY 105<br />
[3.67] G. Cambi, M.T.<br />
Porfiri, P. Meloni, NAUA<br />
model for accident<br />
analyses for ITER GSSR,<br />
<strong>ENEA</strong> FUS-TN-SA-SE-<br />
R-007B (2001)<br />
[3.68] M.T. Porfiri,<br />
G.Cambi, P. Meloni,<br />
Accident Safety<br />
Analyses, for ITER GSSR<br />
– Pump seizure in divertor<br />
HTS, large divertor exvessel<br />
coolant leak, <strong>ENEA</strong><br />
FUS-TN-SA-SE-R-007A<br />
(2001)<br />
[3.69] M.T. Porfiri,<br />
G.Cambi, P. Meloni,<br />
Additional accident<br />
safety analysis for ITER<br />
GSSR – Large DV exvessel<br />
coolant leak, <strong>ENEA</strong><br />
FUS-TN-SA-SE-R-008A<br />
(2001)<br />
[3.70] M.T. Porfiri,<br />
G.Cambi, P. Meloni,<br />
Parametric accident<br />
safety analysis for ITER<br />
GSSR - A) Divertor exvessel<br />
coolant leak during<br />
baking, <strong>ENEA</strong> FUS-TN-<br />
SA-SE-R-008B (2001)<br />
[3.71] T. Pinna, C.<br />
Rizzello, Failure mode<br />
and effect analysis for<br />
tritium systems of ITER<br />
FEAT, <strong>ENEA</strong> FUS-TN-<br />
SA-SE-R-017 (2001)<br />
[3.72] T. Pinna, L.<br />
Burgazzi, Failure mode<br />
and effect analysis for<br />
neutral beam injectors of<br />
ITER FEAT, <strong>ENEA</strong> FUS-<br />
TN-SA-SE-R-018 (2001)<br />
[3.73] T. Pinna, L.<br />
Burgazzi, Failure mode<br />
and effect analysis on<br />
ITER FEAT: last results<br />
to be introduced on<br />
GSSR Vol.X., neutral<br />
beam Injectors, Magnets,<br />
<strong>ENEA</strong> FUS-TN-SA-<br />
SE-R-016 (2001)<br />
Fig. 3.45 – Ex-vessel DV<br />
coolant leak.<br />
Deterministic accident analyses<br />
The design basis accidents relating to pump seizure and large divertor (DV) coolant<br />
leak were assessed for the ITER-FEAT design. The NAUA nodalizations [3.67] were<br />
updated, and the model for the wet aerosol deposition was implemented. The<br />
accident analyses for the GSSR were iterated twice to optimise safety system<br />
operation and evaluate critical parameters such as containment pressure. Different<br />
boundary conditions were set for the first [3.68] and second [3.69] analyses:<br />
a) The set point for the bleed lines opening towards the drain tank and the<br />
suppression tank (110 kPa in the first assessment and 80 kPa in the second), to<br />
maintain the vacuum vessel in low pressure conditions as long as possible.<br />
b) The position of an ex-vessel break in the DV cooling loop, to maximise the vault<br />
pressurisation for fluid discharge.<br />
For pump seizure, the leakage from the vacuum vessel results in the following<br />
environmental releases: about 0.18 mg of tritium and about 88 µg of tungsten dust in<br />
the first accident analysis. In the second iteration, about 0.12 mg of tritium and about<br />
250 µg of tungsten dust were calculated. The combined releases remain four orders<br />
of magnitude below the accident release guidelines.<br />
For the first analysis of the ex-vessel DV leak, the total environmental release of<br />
tritium was 66 mg-T. The releases of dust and activated corrosion products (ACPs)<br />
totalled 24 and 270 mg, respectively. In the second iteration, the total environmental<br />
release of tritium was 685 mg-T, and the total releases of dust and ACPs were 20 and<br />
600 mg, respectively. Even considering the worst accident conditions, which are<br />
more severe in this second scenario, the combined releases are about a factor of 3<br />
below the accident release guidelines.<br />
An ex-vessel DV coolant leak was assessed in baking conditions [3.70] to estimate the<br />
maximum vault pressurisation due to high coolant temperature (240 °C). Figure 3.45<br />
shows the trend of the pressurisation in this case. The design pressure of 200 kPa is<br />
never reached [3.55 (Vol. VII)].<br />
Probabilistic accident analysis<br />
3.12 Safety and Environment, Power<br />
Plant Studies and Socio-Economics<br />
A component-level FMEA was used to identify postulated initiating events (PIEs)<br />
and possible accident consequences for the tritium systems [3.71], neutral beam<br />
injectors [3.72] and magnet systems [3.73] of the ITER-FEAT reactor. The tokamak<br />
and exhaust processing (TEP) system, storage and delivery system (SDS) and isotope<br />
separation systems (ISS) were assessed for the fuel cycle.<br />
(Pa)<br />
2<br />
<strong>1.</strong>6<br />
<strong>1.</strong>2<br />
1<br />
0.8<br />
0.4<br />
0<br />
TCWS vault pressure<br />
0 10 1000 100000<br />
Time (s)<br />
The FMEA table is structured so<br />
that the following data are<br />
reported for each component: all<br />
the possible failure modes that<br />
could occur in the different<br />
operating states; the related<br />
accident frequencies and category<br />
classification; causes of failure and<br />
the preventive actions; consequences<br />
and the preventive/<br />
mitigating actions; the PIEs as<br />
identified by safety-relevant<br />
elementary failure modes and<br />
pertinent comments.
106<br />
3. FUSION TECHNOLOGY<br />
3.12 Safety and Environment, Power<br />
Plant Studies and Socio-Economics<br />
Component failures that could induce a PIE were listed, and the total frequency for<br />
each PIE was determined. The accident sequences following a PIE were qualitatively<br />
defined. All elementary failures without safety-relevant consequences were<br />
classified as a Not Safety Relevant (N/S) PIE.<br />
The overall work is reported in [3.55 (Vol. X)].<br />
Corrosion product modelling and inventories<br />
The divertor/limiter (DV/LIM) cooling loop was modelled with regard to geometry<br />
and thermal-hydraulics. The PACTITER code was utilised to determine the ACP<br />
inventory. The results of the neutron transport and activation analyses were<br />
incorporated in the PACTITER input. To represent the ITER operation, two scenarios,<br />
SA1_acp and M-DRG1, were simulated. The SA1 fluence was 0.5 MWy/m 2 for a<br />
total of 320 days of burn at an average n-wall load of 0.57 MW/m 2 . The M-DRG1<br />
activation scenario (192 days of plasma burn in about 20 years, including two 6-day<br />
campaigns at 25% duty cycle) fluence was 0.3 MWy/m 2 .<br />
The operative phases considered in the two scenarios were burn, dwell, cold and hot<br />
standby, baking and decontamination.<br />
The ACP deposit mass was 8882 g in the SA1 scenario and 7808 g in the M-DRG1<br />
scenario. A large reduction in the ACP inventory in terms of mass and activity was<br />
recorded, compared to the previous ACP assessment for the ITER-FDR DIV loop<br />
(1998 design).<br />
The Cu-alloy release rate strongly depends on the different operating phases. It is<br />
enhanced during baking because of the greater solubility of Cu at 240°C, unlike<br />
stainless steels, where a lower release rate occurs at 240°C. During burn phases, the<br />
release rate increases for all materials because of the temperature gradient in the<br />
loop. The Cu-alloy release rates are of the order of 10 µm/y for baking and burn<br />
periods, while they are extremely low during the other periods (0.01-0.1 µm/y)<br />
[3.74].<br />
Accident sequence analysis for tritium systems<br />
The accident initiators identified by means of the probabilistic assessment were<br />
studied to determine possible accident scenarios. Success and/or failure of the<br />
systems implementing the required safety functions were considered [3.75].<br />
[3.74] L. Di Pace,<br />
Activated Corrosion<br />
Products E valuation for<br />
the ITER TCVS DIV/LIM<br />
Loop, FUS-TN-SA-SE-R-<br />
014 (2001)<br />
[3.75] C. Rizzello, T.<br />
Pinna, Accident sequences<br />
analysis related<br />
to ITER FEAT fuel cycle<br />
systems, <strong>ENEA</strong> FUS-TN-<br />
SA-SE-R-004 (2001)<br />
The principle of the “defence in depth” is implemented in tritium systems by the use<br />
of successive barriers preventing the release of radioactive materials to the<br />
environment. The rationale is to limit the dilution of tritium within each barrier<br />
system, so that it can be recovered before penetrating to the next barrier.<br />
The environments are all equipped with devices capable of automatically isolating<br />
the ventilation systems and switching on the detritiation systems in the case of<br />
accidental release of tritium.<br />
The effectiveness of the fuel cycle system isolation and of the containment barriers<br />
was assessed by evaluating the amount of tritium released from process equipment,<br />
for the reference accidents.<br />
As an example, for the break of a tritium process line inside the glove box (GB)<br />
containment of the tokamak exhaust processing system, the bounding accident<br />
conditions were found for the failure of a fuelling surge tank, which results in 14.5 g<br />
of tritium lost into the GB. Although the GB ventilation is isolated and the
3. FUSION TECHNOLOGY 107<br />
3.12 Safety and Environment, Power<br />
Plant Studies and Socio-Economics<br />
detritiation system activated, until the GB tritium decontamination is over, a small<br />
amount of tritium can escape from the GB towards the operating area, mainly due to<br />
permeation through the gloves and to the environment through the room ventilation<br />
system. For such a sequence, the maximum tritium dispersion to the environment<br />
was estimated to be 0.16 mg, well below the design release limit of 1 g.<br />
The “ultimate safety margins” of the plant were also assessed to confirm that a<br />
further degradation of systems would not lead to cliff-edge effects. Included were<br />
some possible aggravating factors, i.e., lack of isolation of the<br />
broken/malfunctioning system/component, consequential failure of nearby<br />
systems, or H 2 -air reactions in the form of a fire or explosion inside operating areas.<br />
The work demonstrates that tritium releases to the environment are below the design<br />
limits for the overall accident conditions and that the no-evacuation goal of ITER-<br />
FEAT is attained even if the ultimate safety margins are challenged.<br />
[3.76] A. Natalizio, L. Di<br />
Pace, Review of the<br />
current methods for the<br />
management of tritiated<br />
waste, <strong>ENEA</strong> FUS-TN-<br />
SA-SE-R-001 (2001)<br />
[3.77] M. Zucchetti,<br />
Clearance of activated<br />
materials: the ‘de<br />
minimis’ problem, <strong>ENEA</strong><br />
FUS-TN-SA-SE-R-021<br />
(2001)<br />
[3.78] M. Zucchetti, R.<br />
Forrest, L. Di Pace,<br />
Clearance of activated<br />
materials: optimisation<br />
of ex-vessel material<br />
composition, <strong>ENEA</strong> FUS-<br />
TN-SA-SE-R-022 (2001)<br />
[3.79] D. G Cepraga, G.<br />
Cambi, M. Frisoni,<br />
Neutronic calculations<br />
for SEAFP-2 plant<br />
models 2 and 3, <strong>ENEA</strong><br />
FUS-TN-SA-SE-R-024<br />
(2001)<br />
3.12.4 Waste management<br />
Three different studies were performed for this issue.<br />
Review of current methods of tritiated waste management [3.76]<br />
The Canadian radioactive waste management experience was reviewed because of<br />
its potential relevance for fusion reactor studies. In fact, tritium is the element<br />
expected to be common to both fusion and CANDU reactor waste.<br />
The operation and final decommissioning of a fusion power reactor will generate<br />
significant quantities of solid and liquid waste. Whereas some of the waste will be<br />
similar to CANDU reactor waste (e.g., ion-exchange resin, tritiated and activated<br />
cooling system components, tritiated steel, etc.), other waste will be unique to fusion<br />
(e.g., activated and tritiated beryllium, tungsten and silicon carbide).<br />
Clearance of activated materials: the “de minimis” problem [3.77] and<br />
optimisation of ex-vessel material composition [3.78]<br />
The minimisation of active waste from operation and decommissioning of a fusion<br />
power plant has to be one of the main objectives for fusion waste management<br />
studies. Clearance is one of the ways to achieve this goal.<br />
The problem of defining operative clearance levels was discussed in the study. Two<br />
main options were proposed: clearance for non-active disposal or free-release<br />
recycling. The limits proposed were derived from clearance levels for radionuclides<br />
in solid materials (IAEA-TECDOC-855, 1996) and adopted for the “disposal as nonactive<br />
waste” option. The limits indicated by the European Commission Radiation<br />
Protection 89 were taken into account.<br />
Furthermore, a possible optimisation of ex-vessel component composition for the<br />
SEAFP Plant Models 2 and 3 was studied in order to enable their clearance,<br />
considering both options cited above. The study pointed out that the clearance goal<br />
could be reached for many materials without any optimisation. The ex-vessel<br />
components that do not reach the clearance levels are inboard winding pack<br />
(magnets), inboard insulator and the inboard vessel itself. This is valid for both plant<br />
models, even though some differences exist between the two.<br />
Neutronic calculations for SEAFP-2 Plant Models 2 and 3 [3.79]<br />
The activation calculations for assessment of the composition optimisation of fusion<br />
reactor ex-vessel material components were performed by the FISPACT code
108<br />
3. FUSION TECHNOLOGY<br />
3.12 Safety and Environment, Power<br />
Plant Studies and Socio-Economics<br />
[TR-022]. The neutron flux spectra for the ex-vessel zones were provided for the<br />
activation calculation with the FISPACT activation code, in FISPACT format. To get<br />
this data, it was necessary to carry out a neutronic (neutron transport) calculation.<br />
The input data (geometry, material data, irradiation characteristics) were defined in<br />
the framework of the SEAFP project.<br />
The neutron (and gamma) flux distributions were obtained [3.80] by means of the<br />
Bonami-XSDNRPM Sn coupled n-g 1-D discrete ordinates transport calculation<br />
sequence from the SCALE-4.4 computer code system. The Vitamin-<strong>ENEA</strong> Master<br />
Library (174n-38g groups), based on ENDF/B-VI data, was used for the transport<br />
calculation.<br />
3.12.5 Power Plant Conceptual Study<br />
In the framework of studies for future fusion power reactors, three issues were<br />
pursued: occupational radiation exposure (ORE), radioactive waste and recycling<br />
and accident-sequence analysis.<br />
Occupational radiation exposure<br />
In Stage II of the Power Plant Conceptual Study (PPCS), the validity of the public<br />
dose target and the ensuing environmental release targets, as set out in the General<br />
Design Requirements Document (GDRD), were confirmed [3.80].<br />
A centralised refurbishing facility servicing several power plants offers good<br />
economics but requires the transport of activated and contaminated reactor<br />
components on public right-of-ways. Alternatively, a co-located refurbishing facility<br />
eliminates the need for public transport, but offers poor economics. It is envisaged<br />
that the first few fusion power reactors could be constructed on a site adjacent to the<br />
refurbishing facility.<br />
[3.80] A. Natalizio, L. Di<br />
Pace, Assessment of<br />
GDRD safety requirements<br />
in normal<br />
operations (effluents and<br />
occupational doses),<br />
<strong>ENEA</strong> FUS-TN-SA-SE-<br />
R-023 (2001)<br />
The key issues related to ORE include the selection of an appropriate station dose<br />
target, a longer plasma-facing-component (PFC) life, short special maintenance<br />
outages, low-speed pellet injectors and a tubeless blanket.<br />
The station dose target, fixed in GDRD Stage I at 700 p-mSv/a per GWe, could be<br />
modified to 700 p-mSv/a per station unit, irrespective of the net electrical power<br />
output.<br />
The design life of PFCs determines the reactor cycle – the time between in-vesselcomponent<br />
replacement outages. The reactor cycle can be increased in two ways: by<br />
increasing the performance of the PFCs from the GDRD value of 2 FPY (full power<br />
year) and/or reducing the neutron wall loading. The PFC performance can only be<br />
increased by utilising high-performance materials. The neutron wall loading,<br />
however, can be reduced by changing the tokamak design parameters, i.e., making<br />
the tokamak bigger. Physics parameters and magnet technology permitting, the net<br />
result of a bigger tokamak would be a higher capital cost, but the net result of the<br />
increased reactor cycle could be lower annualized, unit electricity cost and worker<br />
doses.<br />
There is a strong correlation between plant unavailability and station dose in nuclear<br />
plants – the higher the unavailability, the higher the dose. The special maintenance<br />
outage in fusion plants adds to plant unavailability and therefore increases station<br />
dose. The GDRD special maintenance outage of six months could potentially<br />
increase normal station dose by an estimated 300-2,000 p-mSv/a. Such a potentially<br />
large dose underscores the importance of reducing the outage duration.
3. FUSION TECHNOLOGY 109<br />
The cooling tubes inside the breeding blanket will be subjected to neutron-induced<br />
sputtering, which is the primary contributor to cooling system maintenance doses.<br />
The total cooling system dose was estimated to be of the order of 290 p-mSv/a.<br />
Therefore, a self-cooled liquid-metal blanket, for example, which eliminates the need<br />
for cooling tubes, would significantly reduce cooling system maintenance doses.<br />
Waste management<br />
3.12 Safety and Environment, Power<br />
Plant Studies and Socio-Economics<br />
[3.81] A. Natalizio, L. Di<br />
Pace, Assessment of<br />
clearance and recycling<br />
from the policy point of<br />
view, in preparation<br />
[3.82] A. Natalizio, L. Di<br />
Pace, Tritium transport<br />
and proliferation issues,<br />
in preparation<br />
Assessment of clearance and recycling from the policy viewpoint [3.81]. A valid<br />
analogy exists between in-vessel components that need to be replaced on a regular<br />
basis and used fission reactor fuel, even if there are significant differences in the type<br />
of waste and radiotoxicity. The fission power industry has followed two basic<br />
strategies for used fuel disposal: the once-through fuel cycle and the closed-fuel<br />
cycle, which includes reprocessing of the used fuel. These two strategies are also<br />
available to the future fusion power industry. The key question is to determine the<br />
technical and economic feasibility of used, in-vessel component (IVC) refurbishment<br />
and reprocessing. Seven scenarios were developed and studied to identify the factors<br />
that are important in the development of a suitable fusion-power waste management<br />
strategy dealing with the interim storage, refurbishment/reprocessing, and final<br />
disposal of waste. The scenarios studied range from doing very little<br />
refurbishment/reprocessing to doing the maximum refurbishing/reprocessing that<br />
is practical, both on-site and off-site. The key criterion in evaluating the various<br />
scenarios was the environmental acceptability of the fusion power plant. More<br />
specifically, the aim was to identify scenarios that would eliminate or reduce the<br />
shipment of radioactive materials to and from centralised fuel reprocessing facilities.<br />
The following conclusions were drawn from the study:<br />
<strong>1.</strong> Future fusion power plants should be constructed as multi-unit plants with<br />
adjacent in-vessel component refurbishing facilities.<br />
2. Tritium recovery from blanket modules is expected to reduce the cost of IVC<br />
refurbishment.<br />
3. Reprocessing the breeder and neutron multiplier material may not be economical<br />
unless the reprocessing unit cost is significantly lower than a few hundred Euro/kg.<br />
4. Without IVC refurbishing, the operational IVC waste volume will far exceed the<br />
decommissioning waste volume.<br />
Tritium transport and proliferation issues [3.82]. The objective was to analyse the<br />
tritium transport and proliferation issues that could arise from the transport of<br />
considerable quantities of tritium to and from future fusion power plants. These<br />
potential issues were addressed in the context of a mature fusion power industry.<br />
Two aspects were considered: the public safety of tritium shipments (i.e., the<br />
potential for radiation exposure in the event of a shipping accident); and the<br />
proliferation aspects of tritium shipment (i.e., the potential for the hijacking of<br />
tritium shipments by terrorist organisations). Based on simple analyses it was<br />
demonstrated that there will be a need to ship significant quantities of tritium, to and<br />
from a future fusion power plant, on an annual basis. This could be of the order of<br />
10 kg per year.<br />
Tritium has been safely shipped in licensed shipping containers for many years and<br />
without incidents that could constitute a public risk. Current shipping containers in<br />
Canada are designed and licensed to transport 50 g of tritium, but larger containers<br />
have also been considered in past studies, for example for ITER. Considering the<br />
large quantities of tritium to be shipped to and from a future fusion power plant, a
110<br />
3. FUSION TECHNOLOGY<br />
3.12 Safety and Environment, Power<br />
Plant Studies and Socio-Economics<br />
container of 1000-g capacity would not be considered unreasonable to limit the<br />
number of shipments and hence the risk of possible hijacking by terrorists.<br />
Tritium (and other fusion materials) is excluded from the Non-Proliferation Treaty;<br />
nevertheless, tritium can be shipped across national borders only if there exists a<br />
nuclear co-operation agreement between the countries involved.<br />
Accident sequences analysis<br />
Accident analyses have to verify that the future reactors concepts do no represent a<br />
safety concern. A list of the data necessary for the accident analyses in the PPCS was<br />
prepared [3.83]. The main scope of the work was to have a common database for the<br />
analysts working on accident analyses, to avoid incongruent final results due to the<br />
different assumptions and parameters used.<br />
[3.83] M.T. Porfiri,<br />
Required data for the<br />
accident analyses in<br />
power plant conceptual<br />
study assessment, <strong>ENEA</strong><br />
FUS-TN-SA-SE-R-027<br />
(2001)<br />
3.12.6 European ITER site at Cadarache<br />
In 2001, EFDA charged the European ITER Site Study Group (EISSG) with the tasks<br />
of verifying whether the ITER Site Requirements and Assumptions could be met at<br />
Cadarache and studying and estimating any necessary adaptation works. <strong>ENEA</strong>’s<br />
Fusion Division acted as overall co-ordinator of the work and also provided<br />
substantial support in the following fields:<br />
Safety and Licensing. The scope of the task was to verify whether the ALARA<br />
approach had been implemented in the ORE assessments for ITER and that it was<br />
compatible with French regulations.<br />
Socio-Economy. The Socio-Economic Research on Fusion (SERF) already performed<br />
for the ITER Generic Site was reviewed for adaptation to Cadarache. The problem of<br />
public awareness and acceptance of fusion was investigated.<br />
Electrical Power Supply. The effect of the ITER electrical load on the Cadarache local<br />
network was studied. The ITER power supply design modifications were identified<br />
and evaluated, and improvements to the ITER design were suggested. <strong>ENEA</strong> was<br />
also responsible for co-ordinating the work of other laboratories (CEA, RFX) and of<br />
European industries (e.g., European Fusion Engineering & Technology).
4. MISCELLANEOUS 113<br />
4.1 Development of CVD Diamond<br />
Detectors for Nuclear Radiation<br />
Diamond detectors are of particular interest as neutron detectors in fusion<br />
environments since they present higher radiation resistance than silicon detectors. In<br />
collaboration with the Faculty of Engineering of Tor Vergata University in Rome,<br />
diamond films produced with the chemical vapour deposition (CVD) method are<br />
being developed and their characteristics analysed for nuclear detection.<br />
During 2001, several new samples of CVD diamond were grown and tested with<br />
nuclear particles (alpha particles and electrons) to investigate important parameters<br />
such as grain dimensions, film purity and lattice properties [4.1].<br />
[4.1] M. Marinelli et al.,<br />
Phys. Rev. B, 64,<br />
195205–1 (2001)<br />
[4.2.] R. Bernabei et al.,<br />
Eur. Phys. J. Direct, C11,<br />
1 (2001)<br />
[4.3] G. Barbiellini et al.,<br />
CP587, GAMMA 2001:<br />
G a m m a - R a y<br />
Astrophysics, pag 774<br />
(2001)<br />
The film quality was studied as a function of the growing parameters (methane<br />
concentration, substrate temperature, chamber volume, film thickness) to establish<br />
whether or not it was possible to optimise the quality of diamond films. Alpha<br />
particles of different energy were used to study the film properties. Hence, by<br />
considering the penetration depth at each energy, it was possible to define the grain<br />
size and the collection length. The present quality of CVD films grown at Tor Vergata<br />
University in collaboration with <strong>ENEA</strong> represents the state-of-the-art for these<br />
materials in terms of charge collection efficiency (70%). The work pointed out that,<br />
to improve detection efficiency, it is necessary to improve film purity.<br />
4.2 Light Response of a Pure<br />
Liquid Xenon Scintillator<br />
The search for dark matter is one of the most stimulating fields in fundamental<br />
physics. To establish in which form the so-called “missing mass of universe” does<br />
exist represents a result of paramount importance to understanding the structure of<br />
the universe. Several experiments are being carried out world-wide to detect<br />
particles that are candidates as “dark matter”. One of these experiments, actually<br />
named Dark Matter (DAMA), is being conducted by the Italian Institute for Nuclear<br />
Physics (INFN) at the “Gran Sasso” underground laboratory and is devoted to<br />
searching for the so-called Weak Interacting Massive Particle (WIMP). The DAMA<br />
experiment makes use of different detectors (liquid xenon and NaI) and is based<br />
upon the search of the recoil spectra produced by WIMPs when interacting with the<br />
detectors. It is very important to calibrate the detectors in the energy range where<br />
the recoil spectra are expected. In particular, the so-called quenching of the<br />
scintillator has to be known to properly measure the recoil spectrum. Kinematics<br />
calculations show that the quenching factor can be well reproduced if high-energy<br />
neutrons are used.<br />
Based on this theoretical finding, the liquid xenon detector was calibrated at the<br />
Frascati Neutron Generator (FNG) with the use of 2.5-MeV neutrons. Results of the<br />
calibration and details of the method are reported in [4.2]. The main output of the<br />
calibration campaign was the ratio of the measured amount of light from the xenon<br />
recoil nucleus to the amount of light from an electron of the same kinetic energy<br />
(quenching). Results substantially in agreement with the previous determination<br />
were obtained.<br />
4.3 Partecipation in the AGILE Project:<br />
Collimator and Coded Mask of the<br />
SuperAGILE Detector<br />
AGILE (Astrorivelatore Gamma ad Immagini Leggero) [4.3] is the first mission of the<br />
Small Missions Programme of the Italian Space Agency (ASI). Its main goal is to<br />
monitor the gamma-ray sky in the energy range 30-50 GeV, with a large field of view<br />
(~3 sr), good sensitivity, good angular resolution and good timing. The satellite is
114<br />
4. MISCELLANEOUS<br />
4.3 Partecipation in the AGILE Project:<br />
Collimator and Coded Mask of the<br />
SuperAGILE Detector<br />
presently under construction and is<br />
scheduled for launch in 2004 in an<br />
equatorial orbit, for a lifetime of two<br />
years. SuperAGILE is the x-ray<br />
monitor added on top of the gammaray<br />
tracker. It will have a large field of<br />
view, providing hard x-ray imaging<br />
thanks to its division into four<br />
mutually orthogonal detectors, each<br />
one coupled to a 1-D coded mask<br />
through a collimator. SuperAGILE<br />
will enable the study of a large variety<br />
of cosmic x-ray sources, including gamma-ray bursts, persistent and transient<br />
galactic x-ray sources, as well as many of the brightest extragalactic sources [4.4].<br />
Prediction of the expected x-ray background is of paramount importance in the<br />
design of the sensitivity and performance of a scientific spacecraft [4.5]. <strong>ENEA</strong><br />
contributed to the design of the SuperAGILE masks and collimators through a<br />
Monte Carlo study that has optimised the noise-to-signal ratio and the detector<br />
response.<br />
The technical realisation of the coded mask implied the development of<br />
manufacturing technologies not present in Italy. The task was performed by the firm<br />
of Vaiarelli Milan, a subcontractor of Laben and Oerlikon/Contraves. Figure 4.1<br />
shows one of the alpaca-mask samples made during research to determine the<br />
correct etching flux.<br />
4.4 Advanced Superconducting<br />
Materials and Devices<br />
The experimental activities were focused on transport-property optimisation of<br />
YBCO thick films on metallic substrates. The structural, morphological and transport<br />
properties were characterised as a function of film thickness, and different metallic<br />
substrates, buffer layer architectures and deposition techniques were realised. Two<br />
approaches were followed: the RABiTS [4.6] technique and the inclined substrate<br />
deposition (ISD) technique [4.7]. Nickel-tungsten alloys [4.8] were developed to<br />
obtain a suitable RABiTS substrate for the YBCO-coated conductor fabrication [4.9],<br />
and ISD-CeO 2 film deposition was studied to provide a biaxially textured buffer<br />
layer on polycrystalline metallic substrates [4.10]. The discovery of<br />
superconductivity in MgB 2 compound [4.11] aroused great interest in this new<br />
material; hence, an activity was started to study MgB 2 thin-film deposition on singlecrystal<br />
substrates.<br />
4.4.1 Ni-W based architectures: preliminary results<br />
During 2001 the research on metallic substrates for YBCO-film deposition led to the<br />
fabrication of a new Ni 1-x -W x alloy. Substrates with different tungsten atomic<br />
percent concentration (x) were analysed in terms of <strong>magnetic</strong> properties, revealing a<br />
Curie temperature linear decrease with x, leading to x=5 for temperatures around<br />
350°C.<br />
The structural and morphological properties of Ni 95 W 5 (indicated as Ni-W)<br />
substrates were also studied. The results were better than in the case of other<br />
Fig. 4.1 - Alpaca-mask<br />
sample made during the<br />
research work.<br />
[4.4] G. Barbiellini,<br />
CP587, GAMMA 2001:<br />
Gamma-Ray Astrophysics,<br />
pag 729 (2001)<br />
[4.5] I. Lapshov et al,<br />
CP587, GAMMA 2001:<br />
Gamma-Ray Astrophysics,<br />
pag 769 (2001)<br />
[4.6] A. Goyal et al., Appl<br />
Phys. Lett. 69, 1795<br />
(1996)<br />
[4.7] K. Hasegawa, et al.,<br />
Appl. Supercond. 4 (10-<br />
11), 487 (1996)<br />
[4.8] E.Varesi et al.<br />
Biaxial texturing of Ni<br />
alloy substrates for YBCO<br />
coated conductors, to be<br />
published in Physica C<br />
[4.9] E. Varesi et al.,<br />
Pulsed laser deposition of<br />
high critical current<br />
density YBa 2 Cu 3 O 7 -<br />
y / C e O 2 / N i - W<br />
architecture for coated<br />
conductors applications,<br />
in preparation<br />
[4.10] A. Mancini et al.,<br />
Inclined substrate deposited<br />
CeO 2 films by<br />
electron beam evaporation<br />
on randomly oriented<br />
metallic substrate, in<br />
preparation<br />
[4.11] J. Nagamatsu et al.,<br />
Nature 410, 63 (2001)
4. MISCELLANEOUS 115<br />
4.4 Advanced Superconducting<br />
Materials and Devices<br />
Fig. 4.3 - Polar figures achieved on the (113)YBCO, (111)CeO 2 and<br />
(111)Ni-W peaks. A sharp texture with circular symmetry poles can be<br />
seen.<br />
Ni–based alloys, such as as Ni 89 V 11 , Ni 88 Cr 12 (Ni-V, Ni-Cr), and of pure<br />
Ni as well.<br />
The Ni-W substrates were thermo-mechanically treated with a standard<br />
process that had previously been experimented on different Ni alloys.<br />
Structural analysis of the as-treated Ni-W substrates showed a well-defined<br />
cubic texture with sharp poles (typical w and j-scan FWHM of about 5.5°<br />
and 7°, respectively) and a reduction in the presence of twinned grains and<br />
spurious orientation grain contribution compared to Ni-V and Ni-Cr alloys<br />
(figs. 4.2 and 4.3). Scanning electron microscopy (SEM) investigation of the<br />
substrate surface morphology revealed a lower prominence of grain<br />
boundaries (fig. 4.2).<br />
Fig. 4.2 - Comparison<br />
between surface<br />
morphology of (a) Ni-V,<br />
(b) Ni-Cr and (c) Ni-W.<br />
For Ni-W, the grain<br />
boundaries are less<br />
prominent and there is a<br />
lower percentage of twins<br />
and spurious grains.<br />
4.4.2 Influence of the substrate on YBCO-film transport properties<br />
The YBCO films deposited on Ni-W buffered CeO 2 substrates showed J c values<br />
greater than 1 MA/cm 2 at 77 K in the case of thinner films (250 nm) (fig. 4.4). On<br />
the other hand, 1-mm-thick, 4-cm-long samples exhibited J c values of 6×10 5 A/cm 2<br />
and <strong>1.</strong>4×10 6 A/cm 2 at 77 and 65 K, respectively. The critical current I c achieved on a<br />
strip of 3.5 mm with the length scaled to 1 cm was 57 A at 77 K and 140 A at 65 K.<br />
Another remarkable advantage of the Ni-W substrate is the possibility to deposit<br />
single buffer layer architecture, since the substrate exhibits enhanced oxidation<br />
resistance with respect to pure Ni and other Ni alloys such as Ni-V.<br />
Fig. 4.4 - J c dependence<br />
on external <strong>magnetic</strong> field<br />
for a 220-nm-thick YBCO<br />
film deposited on<br />
CeO 2 /Ni-W architecture.<br />
Critical current density (A/cm2)<br />
106<br />
105<br />
104<br />
103<br />
0<br />
77 K<br />
10<br />
1<br />
0.1<br />
1 2 3 4 5 6<br />
Magnetic Field (tesla)<br />
Critical current (A)<br />
4.4.3 Inclined substrate<br />
deposition of CeO 2<br />
films<br />
on randomly oriented<br />
metallic substrate<br />
CeO 2 film growth by ISD on<br />
randomly oriented metallic<br />
substrate was studied to develop<br />
a biaxially aligned buffer layer<br />
for YBa 2 Cu 3 O 7-δ (YBCO) coated<br />
conductors. CeO 2 films were<br />
deposited by electron beam<br />
evaporation. The deposition<br />
system was equipped with a
116<br />
4. MISCELLANEOUS<br />
4.4 Advanced Superconducting<br />
Materials and Devices<br />
freely rotating sample holder to incline the substrate normal with respect to the<br />
vapour incidence direction of an angle α.<br />
At normal incidence (α=0°), the CeO 2 film showed a fibre texture, with the [111]<br />
direction normal to the substrate and no in-plane texture. On inclining the substrate,<br />
a biaxial textured growth of CeO 2 films is induced (fig. 4.5). The [00l] axis is tilted<br />
relative to the substrate normal n of an angle γ in the opposite direction with respect<br />
to the incidence of the vapour flux. The (200) and (020) poles, at the same χ angle, are<br />
well defined, indicating a high degree of texture. The φ-scan FWHM values decrease<br />
rapidly on increasing α from 15° to 45°, and become almost constant between 45° and<br />
75° (fig. 4.6a). The film thickness has an important influence on the degree of texture:<br />
films more than 1-µm thick show a sharp texture, as can be seen from the φ–scan<br />
FWHM value reported in figure 4.6b.<br />
Qualitatively, the texturing of ISD-CeO 2 film can be explained by considering the<br />
anisotropic growth rate of crystal planes and the anisotropic diffusion along different<br />
crystal directions. In general, films preferentially grow with the fast growing plane<br />
perpendicular to the vapour flux. Typically in fcc materials, such as CeO 2 , the fast<br />
growing plane is the close-packed {111} plane. In the inclined configuration, the same<br />
growth mechanism is present and the {111} planes are the top planes of the column.<br />
These planes are not exactly orthogonal to the vapour incidence direction because of<br />
directional diffusion, which is due to the momentum conservation of the adsorbed<br />
atom parallel to the film surface. Directional diffusion is also responsible for CeO 2<br />
in-plane alignment. The grains that present the crystallographic direction with the<br />
highest diffusion rate aligned with the directional diffusion can grow more than the<br />
other grains, due to a higher mass transport effect. In ISD-CeO 2 films, this direction<br />
coincides with the direction along the {111} planes. The bigger grains mask the<br />
other grains, hence promoting a selection of film orientation; texture improves with<br />
film thickness.<br />
Fig. 4.5 - X-ray (002)<br />
CeO 2 pole figures for<br />
<strong>1.</strong>5-mm-thick film<br />
deposited at α=55° and<br />
Tsub=200°C in vacuum.<br />
The arrow indicates the γ<br />
angle; the ×, the<br />
deposition direction.<br />
φ-scan FWHM (degrees)<br />
40<br />
30<br />
20<br />
10<br />
10 20 30 40 50 60 70 80<br />
α (degrees)<br />
FWHM<br />
γ<br />
a) b)<br />
90<br />
FWHM 90<br />
40<br />
γ<br />
60<br />
γ (degrees)<br />
φ-scan FWHM (degrees)<br />
30<br />
20<br />
10<br />
0 0,5 1 1,5 2<br />
thickness (µm)<br />
60<br />
γ (degrees)<br />
Fig. 4.6 - φ-scan FWHM<br />
and γ angle values for<br />
CeO 2 film deposited at<br />
Tsub=200°C in vacuum a)<br />
vs. α value (<strong>1.</strong>5-µm-thick<br />
samples) and b) vs. film<br />
thickness (samples<br />
deposited at α=55°).<br />
4.4.4 MgB 2<br />
film fabrication<br />
Different fabrication techniques were used for MgB 2 films on single crystal<br />
substrates. Two main methods were followed: as grown, performed by pulsed laser<br />
deposition (PLD) and in situ annealing, performed both by PLD and by electron<br />
beam evaporation.<br />
In the as-grown method, the MgB 2 film is deposited directly on the single-crystal<br />
substrate, which is heated at a certain deposition temperature in an inert gas<br />
atmosphere.
4. MISCELLANEOUS 117<br />
4.4 Advanced Superconducting<br />
Materials and Devices<br />
Fig. 4.7 - Resistance vs. temperature dependence<br />
for an in situ annealed B/Mg/B trilayer precursor<br />
structure annealed at 630°C for 10 min. The<br />
transition region is magnified in the inset.<br />
Fig. 4.8 - Surface morphology of a B/Mg/B trilayer<br />
annealed at 630°C for 10 min, showing polygonalshaped<br />
grains with a mean grain dimension of about<br />
50 nm.<br />
The in-situ annealing procedure consists of a two-step process. It is performed<br />
without vacuum breaking in a deposition chamber in which a precursor structure is<br />
deposited and then heated to the annealing temperature, at which it is maintained in<br />
inert gas pressure for a certain time. The film is then cooled to room temperature.<br />
Due to high Mg volatility and oxidation, it was difficult to obtain the correct Mg:B<br />
stoichiometry in the deposited films. The highest temperatures at the beginning and<br />
end of the superconducting transition T Conse t and T C0 were, respectively, 33 K and<br />
3<strong>1.</strong>5 K (fig. 4.7), obtained for an in situ annealed sample in which the precursor<br />
structure was a multilayer B/Mg/B architecture deposited by the e-beam technique.<br />
Morphological analysis showed a polygonal-shaped-grain film surface, with a mean<br />
roughness value of about 50 nm (fig. 4.8).<br />
4.5 Optical Metrology Survey<br />
Fig. 4.9 - Alignment of<br />
Elettra Synchrotron<br />
Trieste.<br />
In August 2001, the Fusion Technology Division carried out a 3-D survey of the<br />
storage ring of the Elettra Synchrotron at Trieste, using the Division’s own optical<br />
metrology system (Leica laser tracker). Within the two-weeks’ time window, more<br />
than 2300 measurements<br />
were taken on the 24<br />
bending magnets and 360<br />
quadrupoles and sextupoles<br />
placed in the 260<br />
m circumference storage<br />
ring. The overall root<br />
mean square error of the<br />
oriented network was<br />
less than 100 µm, so it<br />
was possible to<br />
successfully align one<br />
fourth of the synchrotron<br />
(October 2001). This<br />
performance completely<br />
fulfilled the very<br />
demanding survey
118<br />
4. MISCELLANEOUS<br />
4.5 Optical Metrology Survey<br />
specifications in terms of accuracy, time required, and usability of the measurements.<br />
Figure 4.9 shows the metrology apparatus.<br />
4.6 New Hydrogen Energy<br />
During 2001, the activities on the so-called “new hydrogen energy” were based on a<br />
critical revision of the results obtained the previous year. In particular, the objectives<br />
were:<br />
• Experimental demonstration of the Cohn-Aharonov effect, as suggested by G.<br />
Preparata in 1993.<br />
• Design of a compact and easy-to-handle electrolytic cell capable of showing<br />
reproducible excess heat for some hours.<br />
• Detection of 4 He as nuclear ashes generated by the phenomenon.<br />
Past studies have shown that the cold fusion phenomenon, i.e., the capability of<br />
deuterated palladium to produce energy, starts only when a minimum concentration<br />
of deuterium inside the palladium lattice is reached. Studies at <strong>ENEA</strong> Frascati<br />
demonstrated that the intrinsic characteristics of the material have a deep influence<br />
on the possibility to reach the threshold. However, a new effect has recently been<br />
proposed, which is that a voltage drop along the palladium sample could strongly<br />
affect the chemical potential of deuterons inside the metal and decrease it<br />
dramatically. To verify this effect experimentally, thin films with a high electrical<br />
resistance are required in order to prevent Joule heating due to the current flow<br />
through the cathode itself. The solution is represented by a very thin strip (50 µm<br />
wide and 2 µm thick) deposited on a substrate in a geometry that is suitable for a<br />
length of about one meter This choice of geometry was a crucial feature because of<br />
the intrinsic mechanical fragility of such a structure. However, after studies on how<br />
to optimise the deposition technique, highly stable films were obtained that were<br />
capable of undergoing several load-deload cycles without mechanical break. This<br />
was fundamental for obtaining tangible proof of the Cohn-Aharonov effect and<br />
easily reaching the threshold in deuterium concentration. Extra power was<br />
measured clearly each time such a threshold was<br />
exceeded.<br />
The average amount of power released in each<br />
experiment was about 20 mWatt (standard<br />
deviation <strong>1.</strong>6 mWatt); but if related to the sample<br />
dimensions (10 -4 cm 3 ), this value corresponds to<br />
200 Watt/cm 3 . Further development is required<br />
to increase such a yield. Figure 4.10 shows a<br />
device hosting six electrolytic cells.<br />
The nature of the heat excess produced during<br />
deuteride formation is an outstanding problem.<br />
The most common idea is that 4 He atom<br />
formation from the D+D reaction releases about<br />
24 MeV to the lattice and is responsible for the<br />
excess heat measured. The most common<br />
method to detect 4 He atoms eventually present<br />
in the gases evolving from an electrolytic cell is<br />
based on high-resolution mass spectroscopy,<br />
which allows the resolution of 4 He and D 2 masses. Due to the high level of 4 He<br />
contamination in normal air (5 ppm), an ultrahigh vacuum system was assembled in<br />
which all gases except the nobles are pumped out from the analytic chamber by<br />
means of a getter alloy pump. This feature allows a static mode of operation, in<br />
Fig. 4.10 - Multiple-cell<br />
prototype.
4. MISCELLANEOUS 119<br />
4.6 New Hydrogen Energy<br />
which gases evolving from the cell are accumulated and analysed in real time to<br />
measure the amount of 4 He atoms contained in each sample and to correlate it with<br />
the excess heat measured. The feasibility of a static measurement of the possible<br />
presence of 4 He, intended as nuclear ash of the D+D nuclear reaction, was<br />
demonstrated and extensive and accurate calibration of the quadrupole mass<br />
spectrometer was carried out.<br />
The activities concerning the contract awarded to <strong>ENEA</strong> and OCEM in June 2000 for<br />
the manufacture and testing of by-pass diodes for the quench protection of the dipole<br />
and quadrupole magnets of the Large Hadron Collider (LHC) at CERN were<br />
successfully pursued.<br />
During 2001, about 320 diode-stacks for dipole magnets and 100 diode-stacks for<br />
quadrupole magnets were tested, thus maintaining the proper testing rate to be able<br />
to complete the measurement campaign on all the stacks (1250 for the dipoles and<br />
400 for the quadrupoles) within December 2004, as requested by CERN.<br />
A paper was presented at the 2001 CEC/ICMC conference, describing the<br />
experimental set-up, the data acquisition system developed at <strong>ENEA</strong> for the diodestack<br />
testing and the results obtained.<br />
4.8.1 Liquid helium service<br />
The new helium liquefier, installed at the end of April 1999, operated regularly<br />
during 200<strong>1.</strong> The facility consists of a TCF20 cold box equipped with an internal<br />
auto-purifier and two turbine expanders for gas pre-cooling, a screw driven DS220<br />
recycling compressor equipped with an oil removal system, a line drier, a pressure<br />
control panel, two 1,000 l dewars for liquid helium storage, two transfer and decant<br />
lines, a 7 m 3 pure helium buffer tank and an analytical panel equipped with a purity<br />
monitor and a moisture meter. The plant, supplied by Linde Cryogenics Ltd. (UK), is<br />
automatically controlled by an Allen Bradley Programmable Logic Controller. The<br />
liquid helium production rates, with or without liquid nitrogen precooling, are better<br />
than the nominal rates of 60 and 30 l/h.<br />
The liquid helium consumption underwent a consistent increase during the year<br />
because of a new activity started at the Frascati Superconductivity Section<br />
concerning the testing of diodes for the superconducting magnets of CERN. The<br />
overall liquid helium production was about 38,000 l. Nearly 50,000 l of liquid helium<br />
were delivered to the users, and about 12,000 l were acquired to reintegrate the<br />
helium inventory, with a recovery efficiency of about 76%.<br />
4.8.2 Cryogenic technologies<br />
4.7 Cryogenic Testing of<br />
Diode Stacks for CERN<br />
4.8 Cryogenics<br />
The development of a low-noise single shot 3 He/ 4 He dilution refrigerator based on<br />
the use of cryosorption pumps was pursued during the first eight months of 2001, in<br />
the context of a two year co-operative agreement between <strong>ENEA</strong> and the Physics<br />
Department at the University of Rome 3. The objective of the activity was to<br />
demonstrate the feasibility of a dilution refrigerator capable of achieving<br />
temperatures below 100 mK with an operating cycle of at least 10 h. Cryosorption<br />
pumps eliminate vibrations and mechanical noise, which is one of the main<br />
requirements for many space- and earth-based applications.
120<br />
4. MISCELLANEOUS<br />
4.8 Cryogenics<br />
The prototype consists of three refrigerating stages; the first can be cooled down to<br />
about <strong>1.</strong>5 K, by pumping on a liquid 4 He bath, which allows liquefaction of the 3He<br />
and the 3 He/ 4 He mixture stored in the second and third stages, respectively.<br />
Pumping on liquid 3 He in the second stage makes it possible to achieve<br />
temperatures below 300 mK, thus ensuring a good phase separation of the gas<br />
mixture in the mixing chamber. The final cool-down is realised by pumping on the<br />
3 He rich phase.<br />
Preliminary experiments gave encouraging results, with a minimum recorded<br />
temperature at the mixing chamber of about 127 mK. The temperatures of the second<br />
and third stages, during a typical dilution test, are as follows. The mixing chamber<br />
temperature reaches a first plateau at 175 mK, lasting about 3 h, then it achieves its<br />
minimum (135 mK in this run). The existence of the first plateau in not yet well<br />
understood. The overall duration of the dilution process (T
5. INERTIAL CONFINEMENT 123<br />
5.1 Introduction<br />
For the reference period we shall report on (i) the preparation of a new experimental<br />
campaign on laser-foam interaction that implied the assembling and testing on a new<br />
diagnostic line, (ii) the theoretical activity for the preparation of the new experiment<br />
and for the implementation of a new package in the code COBRAN for the treatment<br />
of the energy deposition of the nuclear products (charged particles and neutrons),<br />
and (iv) the design of the diode pumped amplifier.<br />
5.2 Diagnostic Upgrading<br />
The diagnostic package shown in figure 5.1 was assembled for measurements of light<br />
transmission through the target during the laser irradiation.<br />
After the transmitted light conversion to 2ω the target is imaged on a camera and on<br />
the photodiode phd2ω by the lenses 2 and 3. The photodiode phdω is used to register<br />
the waveform of the incident laser beam. A mask was placed on the phd2ω image to<br />
select the probed area where transmission will be measured (typically smaller than<br />
the laser focal area, see figure 5.2).<br />
5.3 Theory<br />
5.3.1 Interaction of laser beams with multi-foil plastic structures<br />
In the following we report on the 2D simulations performed with the lagrangian<br />
code COBRAN to study the evolution of structured plastic targets irradiated by laser<br />
beams<strong>1.</strong> The method used was to start with the simplest material assemblies to begin<br />
a computational study of the interaction of laser beams with large pore foams.<br />
We began with simulations relative to the irradiation of single thin foils, to frame the<br />
Polarizers<br />
Target<br />
Lens 1 Lens 2<br />
Polarizers<br />
Beam A<br />
phd<br />
Array of 256<br />
lenses<br />
Camera<br />
/4 plates<br />
stop<br />
SHG<br />
Infrared absorber<br />
Lens 3<br />
Beam<br />
splitter<br />
phd2<br />
Filter<br />
Dump<br />
Target images<br />
Fig. 5.1 - Package for the measurement of the transmitted light and for target<br />
imaging in transmitted light. The photodiode phdω is used to register the<br />
waveform of the incident laser beam. After the transmitted light is converted<br />
to 2 ω, the target is imaged on a camera and on the photodiode phd2ω by the<br />
lenses 2 and 3. A mask is placed on the phd2ω image to select the probed area<br />
where transmission is measured (typically smaller than the laser focal area). The<br />
transmission coefficient is deduced by normalization with shots without target<br />
(anything else unchanged) and taking in to account the dependence on intensity<br />
of the conversion to 2ω. Since the bandwidth of the waveforms registering<br />
system is 6 GHz, the method allows time-resolved measurements within the<br />
laser waveforms.
124<br />
5. INERTIAL CONFINEMENT<br />
5.3 Theory<br />
a<br />
Target<br />
Laser spot<br />
Opaque mask<br />
400 µm<br />
Table 5.I - Single foil simulations<br />
b<br />
5.2 - a) Relative positioning<br />
and sizes of target<br />
and laser spot. The spot<br />
image was taken without<br />
target and combined with<br />
the typical cross section<br />
of a foam target. The<br />
relative positioning is that<br />
adopted in the experiments.<br />
b) Masking of the<br />
laser spot. Although completely<br />
opaque, the mask<br />
is represented as partially<br />
transmitting to show the<br />
relative hole -spot<br />
positions and sizes.<br />
Case number Focalization Foil transparency Transit time<br />
(cm) (tb ns) (ts, ns)<br />
1 -0.015 0.79 0.62<br />
2 -0.030 <strong>1.</strong>1 0.76<br />
3 -0.045 <strong>1.</strong>37 0,85<br />
main physical parameters (typical velocities, burn through time, etc…). Then a<br />
structure composed by 3 parallel layers was considered. The material was assumed<br />
to be CH and the foil thickness d=0.5 µm. In the multi-foil simulations the spacing<br />
between them was s=75 µm (that is an average density of 6.7 mg).<br />
The material was irradiated by <strong>1.</strong>054 µm radiation, focused along the negative<br />
direction of the z-axis (the optical axis) according to a F/1 geometry. The focal spot<br />
was set at different positions along the z-axis for different cases. The pulse of laser<br />
power, triangular as time waveform, started at t=0, achieved the maximum at t=0.7<br />
ns and was set to zero at t=2 ns. The total energy used was 40 J. The solid material<br />
was set on the positive portion of the z axis, starting at z=0.<br />
In the single foil simulations the d=0.5 µm foil was set between z=0 and z=0.5 µm,<br />
and irradiated by focusing with F/1 optics behind the target at z=-0.015 cm, or at<br />
z=–0.03 cm or at z=-0.045. Some of the findings are reported in table 5.I.<br />
The quantity t b in table 5.I represents the time when the foil becomes transparent to<br />
the laser light (due to ablation and transverse expansion), whereas t s represents the<br />
time when the accelerated matter is displaced by a distance, towards negative z,<br />
s=75 µm, the “pores” size. For the cases listed in table 5.I, in spite of the twodimensional<br />
effects, t b >t s . This means that, in a multi-layer structure, matter will be<br />
accumulated from the irradiated layer upon the following one, so that the light will<br />
become faced with an even thicker foil (and so on). In other words a sort of<br />
snowplough process occurs, as mentioned in previous papers in which the<br />
structured nature of the material was not considered. In the following we report<br />
some results for case 3. In figure 5.3 the fraction of absorbed light is represented<br />
(abscissa is time in ns). The absorption drops sharply near the transparency time t b .<br />
In the following some quantities are represented just before t b . In figure 5.4 the
5. INERTIAL CONFINEMENT 125<br />
5.3 Theory<br />
density and laser rays are displayed. About 10 ps later the light is transmitted.<br />
In the picture at left in figure 5.4 the density r is represented as function of the space<br />
coordinates. The map in the center is the density as function of the calculation grid<br />
indexes. At right is shown a detail of rays propagation, with different colors for<br />
different incidence angle.<br />
The situation near t s<br />
is represented in figure 5.5. Rays are refracted in a sort of ring<br />
as seen in the map at top of figure 5.5. In the same figure are also represented the<br />
quantities Z k T e<br />
(where Z is the average ion charge and T e<br />
the electronic<br />
temperature) and the average ion kinetic energy in the flow (that is 1/2 m i<br />
n 2 , where<br />
n is the flow velocity and m i<br />
the ionic mass). Both are measured in °K. Kinetic energy<br />
prevails only in a thin, dense layer destined to splash on the next one in a multi foil<br />
target. From this follows that the flow energy is partially dissipated in a shock wave<br />
driven in the next layer.<br />
The last map shows the distribution of the flow velocity (U z is the component along<br />
z, the positive axis pointing towards the laser).<br />
The process of layer collision was produced in simulations for the interaction of a<br />
three layer target with a light beam focused in such a way to initially reproduce, at the<br />
first exposed surface, the conditions at surface of case 3.<br />
Fig. 5.3 - Fraction of<br />
absorbed light as function<br />
of time for a single foil. A<br />
fast drop in absorption<br />
occurs when the target<br />
becomes transparent.<br />
At the time 0.65 ns the irradiated foil<br />
impinges on the second foil. In figure<br />
5.6 is shown the map of the velocity<br />
along z at this time. Typical negative<br />
velocity is about 2 (in units of 10 7<br />
cm/s). In figure 5.7 is shown the<br />
density map at the same time. The<br />
propagation of the shock wave in the<br />
second foil is clearly seen by the<br />
representation of density in terms of<br />
grid indexes.<br />
-6 -5 -4 -3 -2 -1 0<br />
Logr(g/cc)<br />
Fig. 5.4 – Left: density (r) map 10 ps before light starts to be transmitted<br />
through the target. Center: the figure is a representation of the density as<br />
function of the grid coordinates. Details of ray propagation are shown in the<br />
figure at right.
126<br />
5. INERTIAL CONFINEMENT<br />
5.3 Theory<br />
-5 -4 -3 -2 -1 0<br />
Log[r(g/cc)]<br />
5 5.5 6 6.5 7 7.5 8 8.5<br />
Log[ZTe(°K)]<br />
5 5.5 6 6.5 7 7.5 8 8.5<br />
Log[kin(°K)]<br />
-2 0 2 4 6 8 10<br />
Log[Uz(cm/s/10 -7 )]<br />
Fig. 5.5 - Maps of some relevant quantities at the time ts corresponding to the vacuum closure aftera a flight<br />
of 75 µm. (Te the electronic temperature, kin the ionic kinetic energy associated to the flow, U z the velocity<br />
along the z axis).<br />
Time=0.65 ns<br />
-2 0 2 4 6 8 10<br />
Log[Uz(cm/s/10 -7 )]<br />
Fig. 5.6 - Evolution of a<br />
three foil target. The<br />
focusing conditions on<br />
the first layer from the<br />
right the same as in case<br />
3 of table 5.I. It is shown<br />
the map of the velocity<br />
along z when the first<br />
foil collides with the<br />
second (at t=0.65 ns).<br />
Typical negative velocity<br />
is about 2 (in units of 10 7<br />
cm/s).
5. INERTIAL CONFINEMENT 127<br />
Time=0.65 ns<br />
5.3 Theory<br />
-5 -4 -3 -2 -1 0<br />
Log[r(g/cc)]<br />
Time=0.9 ns<br />
Fig. 5.7 - Density maps at<br />
different times and ray<br />
tracing at 0.9 ns when the<br />
second layer impinges on<br />
the third.<br />
-5 -4 -3 -2 -1 0<br />
Log[r(g/cc)]<br />
At 0.9 ns the second foil, and a part of the first, start to impinge on the third. To be<br />
noted that the impinging time of the first foil on the second foil was 0.65 ns, whereas<br />
the collision with the third follows after 0.25 additional nanoseconds. At 0.9 ns a<br />
substantial transverse flow can be seen. Part of the first foil material flows<br />
transversally between the unperturbed remnants of the first and second foil. Due to<br />
this expansion the light succeeds in penetrating near the second foil surface. The ray<br />
trajectories become quite complex and a remarkable transverse light excursion is<br />
noted. In the same figure 5.7 it is represented the detail of the propagation for 10 rays<br />
and, separately, the path of two most external rays.<br />
The computation has been advanced up to t=0.97781ns. At this time the<br />
computational grid becomes severely distort. At any rate many of the most
128<br />
5. INERTIAL CONFINEMENT<br />
5.3 Theory<br />
interesting and peculiar features contain several grid points and occur where the grid<br />
maintains a reasonable shape. For this reason we believe these features to be<br />
meaningful.<br />
Conclusions could be the following. In the framework of the physical model<br />
included in our code (probably adequate for the modest power densities here<br />
considered), the succession of the events agrees with the model based on the<br />
formation of a cavity surrounded by a dense matter of increasing mass. The ablation<br />
pressure pushes this layer. Most of the cavity energy content is thermal, the kinetic<br />
one being associated to the dense layer flow. Light may wander in a somewhat<br />
erratic way in the cavity.<br />
5.3.2 Code COBRAN implementation<br />
Cobran is a 3D (2 space + time), 3 temperature lagrangian code including "real<br />
matter" equation of state and opacity coefficients. The package for driving energy<br />
deposition includes light/heavy charged particles, ray-traced laser light and raytraced<br />
x-rays. During the reference year the code was implemented by a more<br />
complete package for reaction products energy deposition. Now the thermonuclear<br />
reaction treatment includes finite range charged particles diffusion and non-thermal<br />
nuclear reactions and the diffusion and energy deposition of neutrons is treated by a<br />
Montecarlo code.<br />
5.3.3 DPSSL Design activity<br />
The block diagram of the diode pumped ABCD was completed and the design of the<br />
sub-amplifiers was frozen. A solution for an efficient energy transfer from the diode<br />
array was found and studied a by a ray-tracing Montecarlo code (fig. 5.8). The<br />
simulations have shown that the quality of the pumping on the active material is<br />
quite good (fig. 5.9).<br />
Fig. 5.9 - Montecarlo simulations show<br />
that about 97.3% of rays hit the useful<br />
slab area. Reflection losses on the<br />
involved optics are modest.<br />
Fig. 5.8 - Montecarlo simulations<br />
for energy transfer from a diode<br />
array to an active element.
Projects<br />
FUSION - DIVISION DIRECTORATE<br />
FRASCATI<br />
M.Samuelli<br />
Assoc. Directors: F. De Marco<br />
G.B. Righetti<br />
G. Valli<br />
Plasma Physics Application<br />
L. Rapezzi<br />
Scientific Secretariat<br />
F. De Marco (acting)<br />
Intense Neutron Source<br />
B. Riccardi<br />
Administration & Control<br />
N. Manganiello<br />
Radiofrequency<br />
G.B. Righetti (acting)<br />
JET/NET Personnel<br />
M. Samuelli (acting)<br />
Conceptual Reactor Studies<br />
A. Pizzuto (acting)<br />
Research Center Brasimone<br />
D. Cassarini<br />
NET/ITER<br />
A. Pizzuto<br />
Electrical Engineering<br />
A. Coletti<br />
Deputy Director Experimental Engineering<br />
G. Benamati<br />
Deputy Director Fusion Technology<br />
A. Pizzuto<br />
Inertial Confinement Fusion<br />
A. Caruso<br />
Deputy Dir. Magnetic Confinement Fusion Physics<br />
F. Romanelli
PUBLICATIONS, CONFERENCES AND REPORTS 131<br />
Publications<br />
01/002 M. MARINELLI, E. MILANI, A. PAOLETTI, A. TUCCIARONE, G. VERONA<br />
RINATI, M. ANGELONE, M. PILLON<br />
Systematic study of the normal and pumped state of high efficiency diamond particle<br />
detectors grown by chemical vapor deposition<br />
J. Appl. Phys. 89, 2, 1430 (2001)<br />
01/004 D. PACELLA, G. PIZZICAROLI, L. GABELLIERI, M. LEIGHEB, R. BELLAZINI,<br />
A. BREZ, G. GARIANO, L. LATRONICO, N. LUMB, G. SPANDRE, M.M. MASSAI,<br />
S. REALE<br />
Ultrafast soft x ray 2D plasma imaging system based on gas electron multiplier detector<br />
with pixel read-out<br />
Rev. Sci. Instrum. 72, 2, 1372 (2001)<br />
01/005 P. SARDAIN, C. GIRARD, J. ANDERSSON, M.T. PORFIRI, R. KURIHARA,<br />
X. MASSON, G. MIGNOT, T. PINNA, L. TOPILSKI<br />
Modelling of two-phase flow under accidental conditions fusion codes benchmark<br />
Fusion Eng. Des. 54, 555-561 (2001)<br />
01/007 A. NATALIZIO, L. DI PACE, T. PINNA<br />
Assessment of occupational radiation exposure for two fusion power plant designs<br />
Fusion Eng. Des. 54, 375-385 (2001)<br />
01/008 V. VIOLANTE, P. TRIPODI, C. LOMBARDI<br />
Le conoscenze attuali sulla fusione nucleare fredda<br />
La termotecnica, marzo 2001, pp. 67-72<br />
01/015 H. FREIESLEBEN, D. RICHTER, K. SEIDEL, S. UNHOLZER, Y. CHEN,<br />
U. FISCHER, M. ANGELONE, P. BATISTONI, M. PILLON<br />
Experimental validation on shut-down dose rates measurement of dose rates, decay rays and<br />
neutron flux<br />
Dresden Report TUD-IKTP/01-01<br />
01/016 A. LA BARBERA, B. RICCARDI, A. DONATO, C.A. NANNETTI,<br />
L. F. MORESCHI<br />
Stability of SiC/SiC fibre composites exposed to Li 4 SiO 4 and Li 2 TiO 3 in fusion relevant<br />
conditions<br />
J. Nucl. Mater. 294, 223-231 (2001)<br />
01/017 B. DI MARTINO, S. BRIGUGLIO, G. VLAD, P. SGUAZZERO<br />
Parallel PIC plasma simulation through particle decomposition techniques<br />
Parallel Computing 27, 295-314 (2001)
132<br />
PUBLICATIONS, CONFERENCES AND REPORTS<br />
01/018 G. VLAD, S. BRIGUGLIO, G. FOGACCIA, B. DI MARTINO<br />
Gridless finite-size-particle plasma simulation<br />
Comp. Phys. Commun 134, 58-77 (2001)<br />
01/019 V. BOFFA, G. CELENTANO, L. CIONTEA, F. FABBRI, V. GALLUZZI,<br />
U. GAMBARDELLA, G. GRIMALDI, A. MANCINI, T. PETRISOR<br />
Influence of film thickness on the critical current of YBa 2 Cu 3 O 7-x thick films on Ni-V<br />
biaxially textured substrates<br />
IEEE Trans. on Appl. Superconductivity, 11, NO 1, 3158-3161 (2001)<br />
01/020 G. GRIMALDI, V. BOFFA, G. CELENTANO, F. FABBRI, U. GAMBARDELLA,<br />
S. PACE, T. PETRISOR<br />
Critical current hysteresis in low angle Y-BaCu-O bicrystals<br />
IEEE Trans. Appl. Supercond. 11, NO 1, 3776-3779 (2001)<br />
01/021 L. BOTTURA, M. CIOTTI, P. GISLON, M. SPADONI, P. BELLUCCI, L. MUZZI,<br />
S. TURTU' A. CATITTI, S. CHIARELLI, A. DELLA CORTE, E. DI FERDINANDO<br />
Stability in a long length NbTi CICC<br />
IEEE Trans. Appl. Supercond. 11, NO 1, 1542-1545 (2001)<br />
01/022 M.PILLON, M. ANGELONE, R.A. FORREST<br />
A new detector to measure gamma and beta decay power from radionuclides<br />
Nucl. Instrum. Methods Phys. Res. A 461, 582-583 (2001)<br />
01/023 S.E. SEGRE, V. ZANZA<br />
Evolution of polarization for radiation crossing a plasma layer of quasi-transverse<br />
propagation and the interpretation of radioastronomical measurements<br />
Astrophys. J. 554, 408-415 (2001)<br />
01/024 F. CRISANTI, B. ESPOSITO, C. GORMEZANO, A. TUCCILLO, L. BERTALOT,<br />
C. GIROUD, C. GOWERS, R. PRENTICE, K.D. ZASTROW, M. ZERBINI<br />
Analysis of ExB flow shearing rate in JET ITB discharges<br />
Nucl. Fusion 41,7, 883-889 (2001)<br />
01/025 V. VIOLANTE, A. TORRE, G. SELVAGGI, G.H. MILEY<br />
Three dimensional analysis of the lattice <strong>confinement</strong> effect on ion dynamics in condensed<br />
matter and lattice effect on the D-D nuclear reactor channel<br />
Fusion Techn. 39, 266-281 (2001)<br />
01/027 C. FAZIO, G. BENAMATI, C. MARTINI, G. PALOMBARINI<br />
Compatibility tests on steels in molten lead and lead-bismuth<br />
J. Nucl. Mater. 296, 243-248 (2001)
PUBLICATIONS, CONFERENCES AND REPORTS 133<br />
01/028 F. BARBIER, G. BENAMATI, C. FAZIO, A. RUSANOV<br />
Compatibility tests of steels in flowing liquid lead-bismuth<br />
J. Nucl. Mater. 295, 149-156 (2001)<br />
01/030 M. ANGELONE, P. BATISTONI, M. PILLON<br />
Effect of the encapsulating material on the peak3/peak5 response ratio of TLD-300<br />
irradiated with neutrons of variuos energy<br />
Rad. Phys. Chem. 61, 415-416 (2001)<br />
01/031 R. BERNABEI, P. BELLI, R. CERULLI, F. MONTECCHIA, A. INCICCHITTI,<br />
D. PROSPERI, C.J. DAI, M. ANGELONE, P. BATISTONI, M. PILLON<br />
Light response of a pure liquid Xenon scintillator irradiated with 2.5 MeV neutrons<br />
EPJ direct C11, 1-8 (2001)<br />
01/033 A. SESTERO<br />
The Ignition Brachystochrone<br />
J. Plasma Phys. 65, 1, 59-72 (2001)<br />
01/034 A.R. RAFFRAY, R. JONES, G. AIELLO, M. BILLONE, L. GIANCARLI,<br />
H. GOLFIER, A. HASEGAWA, Y. KATOH, A. KOHYAMA, S. NISHIO, B. RICCARDI,<br />
M.S. TILLACK<br />
Design and material issues for high performance SiC f /SiC-based fusion power cores<br />
Fusion Eng. Des. 55, 55-95 (2001)<br />
01/038 M. ANGELONE, T. BUBBA, A. ESPOSITO<br />
Measurement of the mass attenuation coefficient for elemental materials in the range<br />
6
134<br />
PUBLICATIONS, CONFERENCES AND REPORTS<br />
01/046 A. BASILE, G. CHIAPPETTA, S. TOSTI, V. VIOLANTE<br />
Experimental and simulation of both Pd and Pd/Ag for a water gas shift membrane reactor<br />
Sep. Puri. Technol. 25, 549-571 (2001)<br />
01/047 R. CESARIO, A. CARDINALI, C. CASTALDO, M. LEIGHEB, M. MARINUCCI,<br />
V. PERICOLI-RIDOLFINI, F. ZONCA, G. APRUZZESE, M. BORRA, R. DE ANGELIS,<br />
E. GIOVANNOZZI, L. GABELLIERI, H. KROEGLER, G. MAZZITELLI, P. MICOZZI,<br />
L. PANACCIONE, P. PAPITTO, S. PODDA, G. RAVERA, B. ANGELINI, M.L. APICELLA,<br />
E. BARBATO, L. BERTALOT, A. BERTOCCHI, G. BUCETI, S. CASCINO, C. CENTIOLI,<br />
P. CHUILON, S. CIATTAGLIA, V. COCILOVO, F. CRISANTI, F. DE MARCO,<br />
B. ESPOSITO, G. GATTI, C. GOMERZANO, M. GROLLI, F. IANNONE, G. MADDALUNO,<br />
G. MONARI, F. ORSITTO, D. PACELLA, M. PANELLA, L. PIERONI, G.B. RIGHETTI,<br />
F. ROMANELLI, E. STERNINI, N. TARTONI, P. TREVISANUTTO, A.A. TUCCILLO,<br />
O. TUDISCO, V. VITALE, G. VLAD, M. ZERBINI<br />
Reduction of the electron thermal conductivity produced by ion Bernstein waves on the<br />
Frascati Tokamak Upgrade tokamak<br />
Phys. Plasma 8,11, 4721 (2001)<br />
01/049 P. BURATTI AND JET TEAM<br />
High beta plasmas and internal barrier dynamics in JET discharges with optimised shear<br />
Nucl. Fusion 41, 12, 1809 (2001)<br />
01/053 F. DE MARCO<br />
Prospettive della fusione nucleare<br />
Il Nuovo Saggiatore, 17, 5-6, 61-65 (2001)<br />
01/063 G. CELENTANO, A. CAPRICCIOLI, A. CUCCHIARO, M. GASPAROTTO,<br />
A. BIANCHI, G. FERRARI, B. PARODI, G.P. SANGUINETTI, F. VIVALDI, S. ORLANDI,<br />
B. COPPI<br />
Engineering evolution of the ignitor machine<br />
Fusion Eng. Des. 58-59, 815-820 (2001)<br />
01/066 A. CARUSO, C. STRANGIO<br />
Studies on nonconventional high-gain target design for ICF<br />
Laser Part. Beams 19, 295-308 (2001)<br />
01/069 R.A. FORREST, M. PILLON, U. VON MÖLLENDORFF, K. SEIDEL<br />
Validation of EASY-2001 using integral measurements<br />
UKAEA Report FUS 467 (2001)<br />
01/071 S.E. SEGRE<br />
New formalism for the analysis of polarization evolution for radiation in a weakly<br />
nonuniform, fully anisotropic medium: a magnetized plasma<br />
J. Opt. Soc. Am. A 18, 10, 2601 (2001)
PUBLICATIONS, CONFERENCES AND REPORTS 135<br />
01/074 A. NATALIZIO, T. PINNA, L. DI PACE<br />
Impact of plant incidents on worker radiation exposure for the SEAFT design<br />
Fusion Eng. Des. 58-59, 1065-1069 (2001)<br />
01/076 R.K. MAIX, H. FILLUNGER, F. HURD, E. SALPIETRO, N. MITCHELL,<br />
P. LIBEYRE, P. DECOOL, A. ULBRICHT, G. ZHAN, A. DELLA CORTE, M. RICCI,<br />
D. BRESSON, A. BOURQUARD, F. BAUDET, B. SCHELLONG, E. THEISEN, N. VALLE<br />
Completion of the ITER toroidal field model coil (TFMC)<br />
Fusion Eng. Des. 58-59, 159-164 (2001)<br />
01/077 T. KATO, H. TSUJI, T. ANDO, Y TAKAHASHI, H. NAKAJIMA, M. SUGIMOTO,<br />
T. ISONO, N. KOIZUMI, K. KAWANO, M. OSHIKIRI, K. HAMADA, Y. NUNOYA,<br />
K. MATSUI, T. SHINBA, Y. TSUCHIYA, G. NISHIJIMA, H. KUBO, E. HARA,<br />
H. HANAWA, K. IMAHASHI, K. OOTSU, Y. UNO, T. OOCHI, J. OKAYAMA,<br />
T. KAWASAKI, M. KAWABE, S. SEKI, K. TAKANO, Y. TAKAYA, F. TAJIRI,<br />
A. TSUTSUMI, T. NAKANURA, H. HANAWA, H. WAKABAYASHI, K. NISHII,<br />
N. HOSOGANE, M. MATSUKAWA, Y. MIURA, T. TERAKADO, J. OKANO,<br />
K. SHIMADA, M. YAMASHITA, K. ARAI, T. ISHIGOUOKA, A. NINOMIYA, K. OKUNO,<br />
D. BESSETE, H. TAKIGAMI, N. MARTOVETSKY, P. MICHAEL, M. TAKAYASU, M. RICCI,<br />
R. ZANINO, L. SAVOLDI, G. ZAHAN, A. MARTINED, R. MAIX<br />
First test results for the ITER central solenoid model coil<br />
Fusion Eng. Des. 56-57, 59-70 (2001<br />
01/078 J.L. DUCHATEAU, H. FILLUNGER, S. FINK, R. HELLER, P. HERTOUT,<br />
P. LIBEYRE, R. MAIX, C. MARINUCCI, A. MARTINEZ, R. MEYDER, S. NICOLLET,<br />
S. RAFF, M. RICCI, L. SAVOLDI, A. ULBRICHT, F. WUECHNER, G. ZAHN, R. ZANINO<br />
Test program preparations of the ITER toroidal field model coil (TFMC)<br />
Fusion Eng. Des. 58-59, 147-151 (2001)<br />
01/079 B. DI MARTINO, S. BRIGUGLIO, G. VLAD, G. FOGACCIA<br />
Workload decomposition strategies for shared memory parallel systems with openMP<br />
Scientific Programming 9, 109-122 (2001)<br />
01/081 F. SCARAMUZZI<br />
Dieci anni di fusione fredda: una testimonianza diretta<br />
Bimestrale dell’<strong>ENEA</strong>, Anno 47, 5, 21 (2001)<br />
01/082 M. MARINELLI, E. MILANI, A. PAOLETTI, A. TUCCIARONE,<br />
G. VERONA-RINATI, M. ANGELONE, M. PILLON<br />
Pulse-shape analysis of high efficiency chemical vapor deposition diamond particle<br />
detectors in the normal and pumped state: trapping and detrapping effects<br />
Phys. Rev. B64, 195205-1/195205-8 (2001)<br />
01/085 O.N. JARVIS, P. VAN BELLE, M.A. HONE, G.J. SADLER, G.A.H. WHITFIELD<br />
F.E. CECIL, D.S. DARROW, B. ESPOSITO<br />
Measurements of escaping fast particles using a thin-foil charge collector<br />
Fusion Technol. 39, 84 (2001)
136<br />
PUBLICATIONS, CONFERENCES AND REPORTS<br />
Articles in Course of Publications<br />
L. RAPEZZI, M. PILLON, M. RAPISARDA, M. SAMUELLI, M. ANGELONE, E. ROSSI,<br />
F. MEZZETTI<br />
Development of a mobile and repetitive Plasma Focus<br />
Plasma Sources Science and Technology<br />
F. ROMANELLI<br />
Transport and boundary physics: summary review<br />
Fusion Technol.<br />
G. CELENTANO, T. PETRISOR, V. BOFFA, L. CIONTEA, F. FABBRI, V. GALLUZZI,<br />
U. GAMBARDELLA, A. MANCINI , A. RUFOLONI, E. VARESI<br />
Epitexial oxidation of Ni-V biaxially textured tapes<br />
Physica C<br />
B. DI MARTINO, S. BRIGUGLIO, M. CELINO, G. FOGACCIA, G. VLAD, V. ROSATO,<br />
M. BRISCOLINI<br />
Development of large scale high performance applications with a parallelizing compiler<br />
Int. J. of Computer Research: Special issued on Industrial Applications of Parallel Computing<br />
B. DI MARTINO, S. BRIGUGLIO, M. CELINO, G. FOGACCIA, G. VLAD, V. ROSATO,<br />
M. BRISCOLINI<br />
Experiences on parallelizing compilation for development and porting of large scale<br />
applications on distributed memory parallel systems<br />
Advances in Computation: Theory and Practice<br />
M. SHOUCRI, A. CARDINALI, J.P. MATTE, R. SPIGLER<br />
Numerical study of plasma-wall transition using an Eulerian Vlasov code<br />
European Phys. J. D<br />
V. KRIVENSKI, G. BRACCO, P. BURATTI, G. GIRUZZI, O. TUDISCO, S. CIRANT,<br />
F. CRISANTI<br />
Distortion of the electron distribution bulk during electron cyclotron heating on FTU<br />
Phys. Rev.<br />
S. BRIGUGLIO, B. DI MARTINO, G. VLAD<br />
Workload decomposition strategies for hierarchical distributed-shared memory parallel<br />
systems and their implementation with integration of high level parallel languages<br />
Concurrency and Computation practice & Experience<br />
S. BRIGUGLIO, G. VLAD, F. ZONCA, G. FOGACCIA<br />
Nonlinear saturation of shear Alfvén modes and energetic ion transports in tokamak<br />
equilibria with hollow-q profile<br />
Phys. Lett. A
PUBLICATIONS, CONFERENCES AND REPORTS 137<br />
Contributions to Conference<br />
B. RICCARDI, C.A. NANNETTI, T. PETRISOR, M. SACCHETTI<br />
Low activation brazing materials and techniques for SiCf/SiC composites<br />
ICFRM-10 International Conference on Fusion Reactor Materials<br />
Baden Baden (Germany)) October 14-19, 2001<br />
L. DI PACE, A. NATALIZIO<br />
Waste management aspects of fusion power plant<br />
The 8th International Conference on Environmental Management<br />
Bruges, Belgium September 30-October 4, 2001<br />
M. CIOTTI, A. DI ZENOBIO, P. GISLON, L. MUZZI, M. SPADONI, S. TURTÙ<br />
Loss calculations in a CICC solenoid exposed to rapidly changing <strong>magnetic</strong> fields<br />
EUCAS 2001<br />
Copenaghen (Denmark) August 26-30, 2001<br />
E. BALSAMO, P. BELLUCCI, A. CATITTI, M. CIOTTI, A. DELLA CORTE, P. GISLON,<br />
L. MUZZI, G. PASOTTI, M. RICCI, M. SPADONI<br />
An experiment for the study of the current distribution effect on stability with different conductors<br />
EUCAS 2001<br />
Copenaghen (Denmark) August 26-30, 2001<br />
G. GELENTANO, V. BOFFA, L. CIONTEA, F. FABBRI, V. GALLUZZI,<br />
U. GAMBARDELLA, A. MANCINI, T. PETRISOR, R. ROGAI, A. RUFOLONI, E. VARESI<br />
High J C YBCO coated conductors on non-<strong>magnetic</strong> metallic substrate using YSZ-based buffer layer<br />
architecture<br />
EUCAS 2001<br />
Copenaghen (Denmark) August 26-30, 2001<br />
E. VARESI, V. BOFFA, G. CELENTANO, L. CIONTEA, F. FABBRI, V. GALLUZZI,<br />
U. GAMBARDELLA, A. MANCINI, T. PETRISOR, A. RUFOLONI, A. VANNOZZI<br />
Biaxial texturin of Ni Alloy substrates for YBCO coated conductors<br />
EUCAS 2001<br />
Copenaghen (Denmark) August 26-30, 2001<br />
N. MARTOVETSKY, P. MICHAEL, J. MINERVINI, A. RADOVINSKY, M. TAKAYASU,<br />
C.Y. GUNG, R. THOME, T. ANDO, T. ISONO, T. KATO, H. NAKAJIMA, G. NISHIJIMA,<br />
Y. NUNOYA, M. SUGIMOTO, Y. TAKAHASHI, H. TSUJI, D. BESSETTE, K. OKUNO,<br />
N. MITCHELL, M. RICCI, R. ZANINO, L. SAVOLDI, K. ARAI<br />
Test of the ITER central solenoid model coil and CS insert<br />
17th Int. Conf. on Magnet Technology<br />
Geneva (Switzerland) September, 24-28, 2001
138<br />
PUBLICATIONS, CONFERENCES AND REPORTS<br />
H. FILLUNGER, F. HURD, R.K. MAIX, E. SALPIETRO, D. CIAZYNSKY, J.L.<br />
DUCHATEAU, P. LIBEYRE, A. MARTINEZ, E. BOBROV, W. HERZ, M. SÜER, A.<br />
ULBRICHT, F. WÜCHNER, G. ZAHN, A. DELLA CORTE, M. RICCI, E.<br />
THEISEN, G. KRAFT, A. BOURQUARD, F. BEAUDET, B. SCHELLONG, R.<br />
ZANINO, L. SAVOLDI<br />
Assembly in the test facility, acceptance and first test results of the ITER TF model coil<br />
17th Int. Conf. on Magnet Technology<br />
Geneva (Switzerland) September, 24-28, 2001<br />
D. CIAZYNSKI, M. RICCI, J.L. DUCHATEAU, A. ULBRICHT, F. WUECHNER, G. ZAHN,<br />
H. FILLUNGER, R. MAIX<br />
Resistances of electrical joints in the TF model coil of ITER: comparison of first test results with<br />
samples results<br />
17th Int. Conf. on Magnet Technology<br />
Geneva (Switzerland) September, 24-28, 2001<br />
R. CESARIO, A. CARDINALI, C. CASTALDO, M. LEIGHEB, M. MARINUCCI,<br />
V. PERICOLI-RIDOLFINI, F. ZONCA AND THE FTU GROUP<br />
Transport analysis results of the ion Bernstein wave experiment on the FTU tokamak<br />
28th EPS- Conference on Controlled Fusion and Plasma Physics<br />
Madeira (Portugal) June 18-22, 2001<br />
O.TUDISCO, F. CRISANTI, P.LOMAS, E. JOFFRIN, F. RIMINI, A.BECOULET, L.<br />
BERTALOT, T. BOLZONELLA, G.BRACCO, C. GIROUD, S.CORTES, B. ESPOSITO, N.<br />
HAWKES, S. POPOVICHEV, E.RACHLEW, M. RIVA, AND CONTRIBUTORS TO THE<br />
EFDA-JET WORKPROGRAMME<br />
Effect of internal flux shaping in JET transport barrier<br />
28th EPS- Conference on Controlled Fusion and Plasma Physics<br />
Madeira (Portugal) June 18-22, 2001<br />
O. TUDISCO, E. DE LA LUNA, V. KRIVENSKI, G. GIRUZZI, P. AMADEO, A. BRUSCHI,<br />
F. GANDINI, G. GRANUCCI, V. MUZZINI , A. SIMONETTO, FTU AND ECRH GROUP<br />
Oblique ECE measurements during strong ECH at 140 GHz in FTU<br />
28th EPS- Conference on Controlled Fusion and Plasma Physics<br />
Madeira (Portugal) June 18-22, 2001<br />
M. ROMANELLI, F. ROMANELLI, F. ZONCA<br />
On the optimal choice of the dimensionless parameters of burning plasma physics experiments<br />
28th EPS- Conference on Controlled Fusion and Plasma Physics<br />
Madeira (Portugal) June 18-22, 2001
PUBLICATIONS, CONFERENCES AND REPORTS 139<br />
D. FRIGIONE, P. BURATTI, M. MARINUCCI, E. GIOVANNOZZI, F. POLI, M.<br />
ROMANELLI, M.L. APICELLA, P. AMADEO, G. BRACCO, B. ESPOSITO, L.<br />
GARZOTTI, C. GORMEZANO, G. MONARI , D. PACELLA, L. PANACCIONE, L.<br />
PIERONI, O. TUDISCO AND FTU TEAM<br />
High field, high performance operation in FTU with multiple pellet injection<br />
28th EPS- Conference on Controlled Fusion and Plasma Physics<br />
Madeira (Portugal) June 18-22, 2001<br />
E. GIOVANNOZZI, P. BURATTI, D. FRIGIONE, L. PANACCIONE, O. TUDISCO,<br />
P. SMEULDERS AND FTU TEAM<br />
Sawtooth and M=1 mode behaviour in FTU pellet enhanced discharges<br />
28th EPS- Conference on Controlled Fusion and Plasma Physics<br />
Madeira (Portugal) June 18-22, 2001<br />
E. BARBATO<br />
ECHR studies: internal transport barriers and MHD stabilisation<br />
28th EPS- Conference on Controlled Fusion and Plasma Physics<br />
Madeira (Portugal) June 17-22, 2001<br />
A. DELLA CORTE, A. GHARIB, D. HAGEDORN, S. TURT, G.L. BASILE, A. CATITTI,<br />
S. CHIARELLI, E. DI FERDINANDO, G. TADDIA, M. TALLI, L. VERDINI, R. VIOLA<br />
Cryogenic testing of by-pass diode stacks for the superconducting magnets of the large hadron collider<br />
at CERN<br />
CEC-ICMC 2001 Conference<br />
Madison, Visconsin (USA) July, 2001<br />
F. ALLADIO, A. MANCUSO, P. MICOZZI, F. ROGIER<br />
Chandrasekhar-kendall-Furth configurations for <strong>magnetic</strong> <strong>confinement</strong><br />
4th Symp. on Current Trends in International Fusion Research<br />
Ottawa (Canada) 2001<br />
A. CARDINALI<br />
Modeling of current drive in the high harmonic fast wave experiments<br />
14th Topical Conference on Radio Frequency Power in Plasmas<br />
Oxnard, California (USA) May 7-9, 2001
140<br />
PUBLICATIONS, CONFERENCES AND REPORTS<br />
A.A. TUCCILLO, Y. BARANOV, E. BARBATO, PH. BIBET, C. CASTALDO, R. CESARIO,<br />
W. COCILOVO, F. CRISANTI, R. DE ANGELIS, A.C. EKEDAHL, A. FIGUEIREDO, M.<br />
GRAHAM, G. GRANUCCI, D. HARTMANN, J. HEIKKINEN, T. HELLSTEN, F.<br />
IMBEAUX, T.T.H. JONES, T. JOHNSON, K.V. KIROV, P. LAMALLE, M. LAXABACK, F.<br />
LEUTERER, X. LITAUDON, P. MAGET, J. MAILLOUX, M.J. MANTSINEN, M.L.<br />
MAYORAL, F. MEO, I. MONAKHOV, F. NGUYEN, J-M.NOTERDAEME, V.<br />
PERICOLI-RIDOLFINI, S. PODDA, L. PANACCIONE, E. RIGHI, F. RIMINI, Y. SARAZIN,<br />
A. SIBLEY, A. STAEBLER, T. TALA, D. VAN EESTER AND EFDA-JET<br />
WORK-PROGRAMME CONTRIBUTORS<br />
Recent heating and current drive result on JET<br />
14th Topical Conference on Radio Frequency Power in Plasmas<br />
Oxnard, California (USA) May 7-9, 2001<br />
V. PERICOLI RIDOLFINI, S. PODDA, J. MAILLOUX, Y. SARAZIN, Y. BARANOV,<br />
S. BERNABEI, R. CESARIO, V. COCILOVO, A. EKEDAHL, K. ERENTS, G. GRANUCCI,<br />
F. IMBEAUX, F. LEUTERER, F. MIRIZZI, G. MATTHEWS, L. PANACCIONE, F. RIMINI,<br />
A.A. TUCCILLO AND EFDA-JET CONTRIBUTORS<br />
LHCD coupling during H-mode and ITB in JET plasmas<br />
14th Topical Conference on Radio Frequency Power in Plasmas<br />
Oxnard, California (USA) May 7-9, 2001<br />
V. PERICOLI RIDOLFINI, E. BARBATO, A. BRUSCHI, R. DUMONT, F. GANDINI,<br />
G. GIRUZZI, C. GORMEZANO, G. GRANUCCI, L. PANACCIONE, Y. PEYSSON, S. PODDA,<br />
A.N. SAVELIEV, FTU TEAM, ECH TEAM<br />
Combined LH and ECH experiments in the FTU Tokamak<br />
14th Topical Conference on Radio Frequency Power in Plasmas<br />
Oxnard, California (USA) May 7-9, 2001<br />
F. MIRIZZI , P. PAPITTO<br />
The very high power radiofrequency additional heating systems for the FTU tokamak of the Fusion<br />
Division of <strong>ENEA</strong> in Frascati<br />
Int. Seminar on “Heating by Internal Sources” HIS-01<br />
Padova (Italy) September 12-14, 2001<br />
F. DE MARCO<br />
A look to the future: Fusion<br />
Int. Conference “E. Fermi and Nuclear Energy,<br />
Pisa (Italy) Ottobre 15-16, 2001<br />
P. BATISTONI<br />
Research in the field of neutronics and of nuclear data for fusion<br />
International Conference on “Nuclear Energy in Central Europe 2001”<br />
Portoro (Slovenia) September 10-13, 2001
PUBLICATIONS, CONFERENCES AND REPORTS 141<br />
S. TOSTI, G. CHIAPPETTA, C. RIZZELLO, A. BASILE, V. VIOLANTE<br />
Pd-Ag Membrane reactors for water gas shift<br />
17th North American Catalysis Society Meeting<br />
Toronto, Ontario (Canada) June 3-8, 2001<br />
C.NERI, L. BARTOLINI, A. COLETTI, M.FERRI DE COLLIBUS, G.FORNETTI,<br />
S. LUPINI, F. POLLASTRONE, L. SEMERARO, C. TALARICO<br />
Advanced digital processing for amplitude and range determination in optical RADAR systems<br />
2001 IEEE Real Time Conference<br />
Valencia (Spain) June 4-8, 2001<br />
Reports<br />
RT/ERG/FUS/2001/01 S.E. SEGRE<br />
Exact analytic expressions for the evolution of polarization for radiation propagating in a<br />
plasma with nonuniformly sheared <strong>magnetic</strong> field<br />
RT/ERG/FUS/2001/08 C. LO SURDO<br />
A glorious, yet almost forgotten, mathematical theory, and some possibly new applications<br />
of it to physics<br />
RT/ERG/FUS/2001/09 M. RAPISARDA, M. SAMUELLI<br />
A portable neutron source for landmines detection<br />
RT/ERG/FUS/2001/13 S.E. SEGRE<br />
Comparison of two alternative approaches for the analysis of polarization evolution of em<br />
waves in a nonuniform, fully anisotropic medium: a magnetized plasma<br />
RT/ERG/FUS/2001/14 F. ALLADIO, A. MANCUSO, P. MICOZZI, L. PIERONI, C.<br />
ALESSADRINI, G. APRUZZESE, L. BETTINALI, G. BRACCO, P. BURATTI, A. COLETTI, P.<br />
COSTA, C. CRESCENZI, A. CUCCHIARO, R. DE ANGELIS, T. FORTUNATO, D.<br />
FRIGIONE, M. GASPAROTTO, G. GATTI, R. GIOVAGNOLI, L.A. GROSSO, G.<br />
MADDALUNO, G. MAFFIA, S. MANTOVANI, G. MONARI, C. NARDI, S.<br />
PAPASTERGIOU, M. PILLON, A. PIZZUTO, M. ROCCELLA, M. SANTINELLI, L.<br />
SEMERARO, A. SIBIO, B. TILIA, O. TUDISCO, L. ZANNELLI, V. ZANZA<br />
Proto-Sphera
142<br />
PUBLICATIONS, CONFERENCES AND REPORTS<br />
The Nuclear Fusion Department promotes the dissemination of information on plasma physics<br />
and fusion technology, both nationally and internationally<br />
Conferences organised at <strong>ENEA</strong> Frascati in 2001<br />
Frascati, 22-23/11/01:<br />
International Workshop on FTU Program<br />
Seminars organised and held at Frascati in 2001<br />
12-02-2001 A. DE NINNO - <strong>ENEA</strong> - Frascati, Italy<br />
Il Progetto Nuova Energia da Idrogeno: Nuovi Elementi di Discussione<br />
19-02-2001 P. HAGELSTEIN - MIT - Cambridge, USA<br />
Basic Theory for Lattice-Nuclear Coupling and Anomalous in Metal Deuterides<br />
26-03-2001 C. LO SURDO -<strong>ENEA</strong> -Frascati, Italy<br />
Una Gloriosa ma Quasi Dimenticata Teoria Matematica, e Certe sue Applicazioni alla Fisica<br />
(anche del Plasma) Presuntivamente Nuove<br />
3-04-2001 G. BORRELLI - <strong>ENEA</strong> - Anguillara, Italy<br />
<strong>Fusione</strong> Termonucleare e Opinione Pubblica: L'Esperienza di Porto Torres<br />
6-04-2001 M. ULRICKSON - Albuquerque, USA<br />
Lithium Conditioning and Liquid Walls in Tokamak<br />
23-04-2001 A. COLETTI - <strong>ENEA</strong> - Frascati, Italy<br />
FT3: Risultati dello Studio Concettuale<br />
23-04-2001 A. PIZZUTO - <strong>ENEA</strong> - Frascati, Italy<br />
FT3: Risultati dello Studio Concettuale<br />
23-04-2001 G.B. RIGHETTI - <strong>ENEA</strong> - Frascati, Italy<br />
FT3: Risultati dello Studio Concettuale<br />
23-04-2001 F. ROMANELLI - <strong>ENEA</strong> - Frascati, Italy<br />
FT3: Risultati dello Studio Concettuale<br />
21-05-2001 C. TSALLIS - Centro Brasileiro de Pesquisas - Rio de Janeiro, Brazil<br />
Thermostatistically Speaking, What Anomalous Diffusion, Turbulence, High Energy Physics and<br />
Hydra Viridissima Have in Common<br />
28-05-2001 C.S. PITCHER - MIT - Cambridge, USA<br />
Modelling of the Ignitor Edge Plasma<br />
4-06-2001 A. MAAS -CEA - Cadarache, France<br />
ITER in Cadarache<br />
Conferences and Seminars<br />
11-06-2001 YU. KRAVTSOV - Russian Ac. of Sciences - Moscow, Russia<br />
Complex Rays: From Intellectual Toy to Effective Instrument of Wave Theory
PUBLICATIONS, CONFERENCES AND REPORTS 143<br />
2-07-2001 F. Rogier - ONERA - Toulouse, France<br />
Modello Numerico dei Propulsori ad Effetto Hall<br />
3-07-2001 A. SYKES - UKAEA - Abingdon, U.K.<br />
The Spherical Tokamak Programme at Culham<br />
3-07-2001 G.M. VOSS - UKAEA - Abingdon, U.K.<br />
Spherical Tokamak Power Plant Studies<br />
3-07-2001 H.R. WILSON - UKAEA - Abingdon, U.K.<br />
Theory and Modelling for the Spherical Tokamak<br />
16-07-2001 M. SHOUCRI - C.C.F.M. - Varennes, Montreal, Canada<br />
Numerical Simulation of Plasma-Wall Transition and Plasma Detachment Using an Eulerian<br />
Vlasov Code<br />
23-07-2001 F. ZONCA - <strong>ENEA</strong>- Frascati, Italy<br />
Role of Resonant Vs. Non-Resonant Wave-Particle Interactions in Electro<strong>magnetic</strong> Turbulence<br />
17-09-2001 M. FLEISCHMANN - Salisbury -U.K.<br />
Unfinished business<br />
10-12-2001 J. HOW - CEA - Cadarache, France<br />
The Technical Infrastructure for Remote Participation in the European Fusion Programme<br />
10-12-2001 V. SCHMIDT - CNR - Padova, Italy<br />
The Technical Infrastructure for Remote Participation in the European Fusion Programme
ABBREVIATIONS AND ACRONYMS<br />
149<br />
AC<br />
ACP<br />
AGILE<br />
AITG<br />
ALARA<br />
Alcator C-Mod<br />
ASDEX-U<br />
ASI<br />
alternating current<br />
activated corrosion product<br />
Astrorivelatore Gamma ad Immagini LEggero<br />
Alfvén ion-temperature gradient<br />
as-low-as-reasonably achievable<br />
Tokamak at Massachusetts Institute of Technology, Boston, USA<br />
Axisymmetric Divertor Experiment Upgrade. Tokamak at Garching, Germany<br />
(Association EURATOM-IPP)<br />
Agenzia Spaziale Italiana<br />
BET<br />
BSE<br />
Brunauer-Emitt-Teller<br />
backscattered electron<br />
CEA<br />
CECE<br />
CERN<br />
CESI<br />
CFC<br />
CFK<br />
CIC<br />
CNR<br />
CRPP<br />
CSMC<br />
CTA<br />
CVD<br />
CVI<br />
Commissariat à l’Energie Atomique - France<br />
combined electrolysis catalytic exchange<br />
Organisation Europeénne pour la Recherche Nucléaire- Geneva<br />
Centro Elettrotechnico Sperimentale, Milan<br />
carbon fibre composite<br />
Chandrasekhar-Kendall-Furth<br />
cable in conduit<br />
Consiglio Nazionale delle Ricerche - Italy<br />
Centre de Recherches en Physique des Plasmas, Villigen, Switzerland<br />
central solenoid model coil<br />
Co-ordination Technical Activity<br />
chemical vapour deposition<br />
chemical vapour infiltration<br />
DARMA<br />
DC<br />
DIII-D<br />
DOE<br />
DRP<br />
DTP<br />
DV<br />
Dark Matter (Experiment)<br />
direct current<br />
Doublet III - D-shape. Tokamak at General Atomics San Diego, USA<br />
Department of Energy - U.S.A.<br />
Divertor Refurbishment Platform - <strong>ENEA</strong> - Brasimone<br />
Divertor Test Platform - <strong>ENEA</strong> - Brasimone<br />
divertor<br />
EAF<br />
EBW<br />
European Activation File<br />
electron beam welding
150<br />
ABBREVIATIONS AND ACRONYMS<br />
EC<br />
ECE<br />
ECH<br />
ECRH<br />
EDA<br />
EDI<br />
EFDA<br />
EFF<br />
EFTP<br />
EISSG<br />
EM<br />
EPM<br />
ETG<br />
EU<br />
electron cyclotron<br />
electron cyclotron emission<br />
electron cyclotron heating<br />
electron cyclotron resonance heating<br />
Engineering Design Activities<br />
Edge of IGNITOR (code)<br />
European Fusion Development Agreement<br />
European Fusion File<br />
European Fusion Technology Programme<br />
European ITER Site Study Group<br />
electro<strong>magnetic</strong><br />
energetic particle mode<br />
electron temperature gradient<br />
European Union<br />
FDR<br />
FEAT<br />
FEM<br />
FESAC<br />
FMEA<br />
FFMEA<br />
FIMEC<br />
FNF<br />
FNG<br />
FNS<br />
FTU<br />
FWHM<br />
FZJ<br />
FZK<br />
Final Design Report<br />
Fusion Energy Advanced Tokamak<br />
finite-element method/model<br />
Fusion Energy Science Advisory Committee<br />
failure mode and effect analaysis<br />
functional failure mode and effect analysis<br />
flat-top indentor for mechanical characterization<br />
fast neutron facility<br />
Frascati Neutron Generator - <strong>ENEA</strong> - Frascati<br />
Fusion Neutronics Source - JAERI - Japan<br />
Frascati Tokamak Upgrade - <strong>ENEA</strong> - Frascati<br />
full width at half maximum<br />
Forschungszeuntrum - Jülich - Germany<br />
Forschungszeuntrum - Karlsruhe - Germany<br />
GAE<br />
GB<br />
GDRD<br />
GEM<br />
GSSR<br />
global Alfvén eigenmode<br />
glove box<br />
General Design Requirement Document<br />
gas-electron multiplier<br />
Generic-Site Safety Report<br />
HCPB<br />
HD<br />
helium-cooled pebble bed<br />
hot dipping
ABBREVIATIONS AND ACRONYMS<br />
151<br />
HELICA<br />
HIP<br />
HMGC<br />
HRP<br />
HT<br />
HE-FUS3 Lithium Cassette<br />
hot isostatic pressing<br />
hybrid MHD gyrokinetic code<br />
hot radial pressing<br />
home team<br />
IBW<br />
ICE<br />
ICF<br />
ICRF<br />
ICRH<br />
IEA<br />
IFMIF<br />
INFN<br />
IOC<br />
IR<br />
ISAS<br />
ISD<br />
ISS<br />
ITB<br />
ITER<br />
ITG<br />
IVC<br />
IVROS<br />
IVVS<br />
ion Bernstein wave<br />
Inlet of Coolant Events<br />
inertial <strong>confinement</strong> fusion<br />
ion cyclotron resonance frequency<br />
ion cyclotron resonance heating<br />
International Energy Agency<br />
International Fusion Materials Irradiation Facility<br />
Istituto Nazionale di Fisica Nucleare - Italy<br />
improved Ohmic <strong>confinement</strong><br />
infrared<br />
Integrated Safety Analysis Code System<br />
inclined substrate deposition<br />
isotope separation system<br />
internal transport barrier<br />
International Thermonuclear Experimental Reactor<br />
ion-temperature gradient<br />
in-vessel component<br />
in-vessel remote operating system<br />
in-vessel viewing system<br />
JAERI<br />
JCT<br />
JET<br />
JHU<br />
JRC<br />
JT-60U<br />
Japan Atomic Energy Research Institute - Japan<br />
Joint Central Team<br />
Joint European Torus. Largest EU tokamak, Abingdon U.K. (UKAEA).<br />
John Hopkins University - Maryland - U.S.A.<br />
Joint Research Centre - Ispra - Italy<br />
JAERI Tokamak 60 Upgrade, Naka, Japan<br />
KAW<br />
kinetic Alfvén wave<br />
LCF<br />
LH<br />
low-cycle fatigue<br />
lower hybrid
152<br />
ABBREVIATIONS AND ACRONYMS<br />
LHC<br />
LHCD<br />
LIM<br />
LIVVS<br />
LOCA<br />
Large Hadran Collider (CERN)<br />
lower hybrid current drive<br />
limiter<br />
laser in-vessel viewing system<br />
loss-of-coolant accident<br />
MARFE<br />
MEPHI<br />
MHD<br />
MPGD<br />
MSE<br />
multifaceted asymmetric radiation from the edge<br />
Moscow Engineering Physics Institute<br />
magnetohydrodynamic<br />
micro-pattern gas detector<br />
motional Stark effect<br />
NAG<br />
NBI<br />
NGPS<br />
NSTX<br />
NTM<br />
Nuclear Analaysis Group<br />
neutral beam injection<br />
neutral gas and plasma shielding (code)<br />
National Spherical Tokamak Experiment<br />
neoclassical tearing mode<br />
ODS<br />
ORE<br />
oxide dispersion strengthened<br />
occupational radiation exposure<br />
PAM<br />
PEP<br />
PFC<br />
PIE<br />
PIP<br />
PLC<br />
PLD<br />
POLITO<br />
PPCS<br />
PRF<br />
PTB<br />
PuFF<br />
PWHT<br />
passive-active multijunction<br />
pellet enhanced performance<br />
plasma-facing component<br />
postulated initiating event<br />
polymer infiltration and pyrolysis<br />
programmable logic controller<br />
pulsed-laser deposition<br />
Politecnico di Torino, Italy<br />
power plant conceptual studies<br />
permeation reduction factor<br />
Physikalisch-Technische Braunschweig, Germany<br />
Pulsed Field Facility<br />
post-welding heat treatment<br />
RAE<br />
runaway electron
ABBREVIATIONS AND ACRONYMS<br />
153<br />
rf<br />
RFX<br />
RH<br />
RI<br />
radiofrequency<br />
Reversed Field Pinch Experiment, Padua, Italy (Association EURATOM-<br />
<strong>ENEA</strong>)<br />
remote handling<br />
radiative improved<br />
SANS<br />
SAW<br />
SDS<br />
SEM<br />
SERF<br />
Sex<br />
SexUp<br />
SOC<br />
ssjs<br />
SULTAN<br />
small-angle neutron scattering<br />
submerged arc welding<br />
storage and delivery<br />
scanning electron microscopy<br />
socio economics research on fusion<br />
Stability Experiment<br />
Stability Experiment Upgrade<br />
saturated Ohmic <strong>confinement</strong><br />
subsize joint samples<br />
Superconductor Test Facility, Villigen, Switzerland (Association EURATOM-<br />
Swiss Confederation)<br />
T-10 Large Russian tokamak, Kurchatev Institute, Moscow<br />
TAE<br />
TCV<br />
TCWS<br />
TdeV<br />
TEM<br />
TEP<br />
TEXTOR<br />
TFC<br />
TFMC<br />
TIG<br />
Tore-Supra<br />
TPR<br />
TUD<br />
TZM<br />
toroidal Alfvén eigenmode<br />
Tokamak à Configuration Variable, Lausanne, Switzerland (Association<br />
EURATOM-Swiss Confederation)<br />
tokamak cooling water system<br />
Tokamak de Varenne. Large Canadian tokamak<br />
transmission electron microscopy<br />
tokamak and exhaust processing<br />
Torus Experiment for Technology Oriented Research. Tokamak at Jülich,<br />
Germany (Association EURATOM-FZJ)<br />
toroidal field coil<br />
toroidal field model coil<br />
tungsten inert gas (welding)<br />
Large tokamak at Cadarache, France (Association EURATOM-CEA)<br />
tritium permeation rate<br />
Technical University of Dresden<br />
tungsten-zirconium-molybdenum<br />
UKAEA<br />
United Kingdom Atomic Energy Agency<br />
VRVS<br />
Virtual Rooms Videoconferencing System
154<br />
ABBREVIATIONS AND ACRONYMS<br />
WDS<br />
WIMP<br />
WS-NCS<br />
XRD<br />
water detritiation system<br />
weak interacting massive particle<br />
weak or negative central <strong>magnetic</strong> shear<br />
x-ray diffraction