1. magnetic confinement - ENEA - Fusione
1. magnetic confinement - ENEA - Fusione
1. magnetic confinement - ENEA - Fusione

You also want an ePaper? Increase the reach of your titles
YUMPU automatically turns print PDFs into web optimized ePapers that Google loves.
<strong>1.</strong> MAGNETIC CONFINEMENT<br />
19<br />
the neutron production of the best FTU performances, deuterate diborane (B 2 D 6 ) is<br />
going to be used as the working gas in the near future.<br />
<strong>1.</strong><strong>1.</strong>7 Radiative improved mode in Ohmic plasmas<br />
<strong>1.</strong>1 Tokamak Physics<br />
In many tokamaks, controlled injection of gas impurities (mainly noble gases such as<br />
Ne, Ar and Kr) into the plasma has been found to lead, in certain conditions, to an<br />
improved <strong>confinement</strong> regime, the so-called radiative improved (RI) mode. The<br />
interest in this regime for FTU lies in the fact that it can be obtained with different<br />
<strong>magnetic</strong> configurations (circular or elongated plasmas, limiter or divertor) and<br />
different heating systems (neutral beam injection, ICRH and Ohmic). Moreover, it<br />
couples good energy <strong>confinement</strong> with a large fraction of radiation losses (up to 90%<br />
of total input power), thus alleviating the problems of plasma-wall interactions. Of<br />
course the price to be paid is a larger Z eff and greater plasma dilution.<br />
[<strong>1.</strong>16] M.Z. Tokar et al.,<br />
Plasma Phys. Control.<br />
Fusion 41, B317 (1999)<br />
[<strong>1.</strong>17] M. Bessenrodt-<br />
Weberpals et al., Plasma<br />
Phys. Control. Fusion 34,<br />
443 (1992)<br />
The strategy to look for the RI mode in FTU is based on the interpretation given by<br />
TEXTOR [<strong>1.</strong>16]: impurity injection attenuates the growth rate of the ion temperature<br />
gradient (ITG) instability. This leads to a smaller particle outflow and hence to<br />
peaking of the density profile. As a consequence, ITG turbulence is further<br />
attenuated, or even quenched. In cases where ITG turbulence is the dominant heatloss<br />
mechanism, an increase in energy <strong>confinement</strong> is achieved. In addition, it has<br />
been found that in TEXTOR the energy <strong>confinement</strong> time increases with density.<br />
An experimental campaign was started at FTU at the end of 2001 to explore the<br />
possibility of a RI mode in Ohmically heated plasmas. The aim was to reproduce the<br />
improved Ohmic <strong>confinement</strong> (IOC) regime of ASDEX. [<strong>1.</strong>17]. The plasma target was<br />
chosen so as to clearly see this regime, if it really did exist in FTU. At <strong>magnetic</strong> field<br />
B T =6 T, the plasma current was programmed to be at 0.8-0.9 MA to avoid the<br />
insurgence of MARFEs. The operational density was set at 10 20 m -3 in order to be<br />
well into the saturated Ohmic <strong>confinement</strong> (SOC) regime, where energy <strong>confinement</strong><br />
is independent of density. In FTU the critical density to access SOC is ~0.8 10 20 m -3 .<br />
Deuterium gas puffing was interrupted at 0.45 s, just at the beginning of the current<br />
flat–top, according to the experience on ASDEX. A neon puff (10-30 ms duration)<br />
was injected at 0.6 s, just at the beginning of the current flat–top.<br />
The standard FTU diagnostics was used to obtain the experimental results.<br />
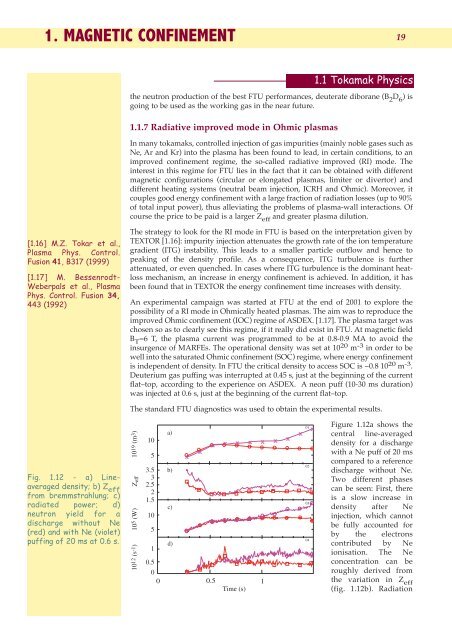
Fig. <strong>1.</strong>12 - a) Lineaveraged<br />
density; b) Z eff<br />
from bremmstrahlung; c)<br />
radiated power; d)<br />
neutron yield for a<br />
discharge without Ne<br />
(red) and with Ne (violet)<br />
puffing of 20 ms at 0.6 s.<br />
1012 (s-1) 105 (W) Zeff 1019 (m3)<br />
10<br />
5<br />
3.5<br />
3<br />
2.5<br />
2<br />
<strong>1.</strong>5<br />
10<br />
5<br />
1<br />
0.5<br />
a)<br />
b)<br />
c)<br />
d)<br />
x<br />
x<br />
0<br />
0 0.5<br />
1<br />
Time (s)<br />
x<br />
x<br />
x<br />
x<br />
x<br />
x<br />
x<br />
x<br />
01<br />
02<br />
03<br />
04<br />
x<br />
Figure <strong>1.</strong>12a shows the<br />
central line-averaged<br />
density for a discharge<br />
with a Ne puff of 20 ms<br />
compared to a reference<br />
discharge without Ne.<br />
Two different phases<br />
can be seen: First, there<br />
is a slow increase in<br />
density after Ne<br />
injection, which cannot<br />
be fully accounted for<br />
by the electrons<br />
contributed by Ne<br />
ionisation. The Ne<br />
concentration can be<br />
roughly derived from<br />
the variation in Z eff<br />
(fig. <strong>1.</strong>12b). Radiation