1. magnetic confinement - ENEA - Fusione
1. magnetic confinement - ENEA - Fusione
1. magnetic confinement - ENEA - Fusione

Create successful ePaper yourself
Turn your PDF publications into a flip-book with our unique Google optimized e-Paper software.
MW 1012 s-1 keV MA<br />
<strong>1.</strong> MAGNETIC CONFINEMENT<br />
11<br />
<strong>1.</strong>1 Tokamak Physics<br />
[<strong>1.</strong>2] G. Tresset et al., A<br />
dimensionless criterion<br />
for characterizing internal<br />
transport barriers in<br />
JET, accepted for<br />
publication on Nucl. Fusion<br />
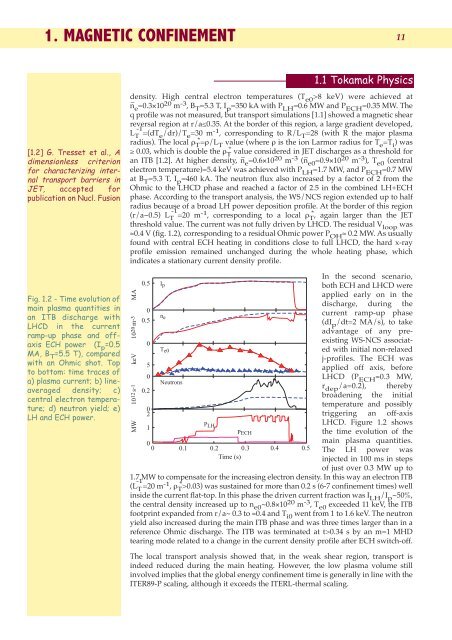
Fig. <strong>1.</strong>2 - Time evolution of<br />
main plasma quantities in<br />
an ITB discharge with<br />
LHCD in the current<br />
ramp-up phase and offaxis<br />
ECH power (I p =0.5<br />
MA, B T =5.5 T), compared<br />
with an Ohmic shot. Top<br />
to bottom: time traces of<br />
a) plasma current; b) lineaveraged<br />
density; c)<br />
central electron temperature;<br />
d) neutron yield; e)<br />
LH and ECH power.<br />
density. High central electron temperatures (T e0 >8 keV) were achieved at<br />
n _ e =0.3×10²⁰ m -3 , B T =5.3 T, I p =350 kA with P LH =0.6 MW and P ECH =0.35 MW. The<br />
q profile was not measured, but transport simulations [<strong>1.</strong>1] showed a <strong>magnetic</strong> shear<br />
reversal region at r/a≤0.35. At the border of this region, a large gradient developed,<br />
L T<br />
-1 =(dTe /dr)/T e =30 m -1 , corresponding to R/L T =28 (with R the major plasma<br />
radius). The local ρ T * =ρ/L T value (where ρ is the ion Larmor radius for T e =T i ) was<br />
≥ 0.03, which is double the ρ T * value considered in JET discharges as a threshold for<br />
an ITB [<strong>1.</strong>2]. At higher density, n _ e =0.6×10²⁰ m -3 (n _ e0 =0.9×10²⁰ m -3 ), T e0 (central<br />
electron temperature)=5.4 keV was achieved with P LH =<strong>1.</strong>7 MW, and P ECH =0.7 MW<br />
at B T =5.3 T, I p =460 kA. The neutron flux also increased by a factor of 2 from the<br />
Ohmic to the LHCD phase and reached a factor of 2.5 in the combined LH+ECH<br />
phase. According to the transport analysis, the WS/NCS region extended up to half<br />
radius because of a broad LH power deposition profile. At the border of this region<br />
(r/a~0.5) L T<br />
-1 =20 m -1 , corresponding to a local ρ T * , again larger than the JET<br />
threshold value. The current was not fully driven by LHCD. The residual V loop was<br />
≈0.4 V (fig. <strong>1.</strong>2), corresponding to a residual Ohmic power P OH ≈ 0.2 MW. As usually<br />
found with central ECH heating in conditions close to full LHCD, the hard x-ray<br />
profile emission remained unchanged during the whole heating phase, which<br />
indicates a stationary current density profile.<br />
1020 m-3<br />
0.5<br />
0<br />
0.5<br />
0<br />
5<br />
0<br />
0.2<br />
0<br />
2<br />
1<br />
I p<br />
n e<br />
T e0<br />
Neutrons<br />
0<br />
0 0.1<br />
P LH<br />
PECH<br />
0.2 0.3 0.4 0.5<br />
Time (s)<br />
In the second scenario,<br />
both ECH and LHCD were<br />
applied early on in the<br />
discharge, during the<br />
current ramp-up phase<br />
(dI p /dt=2 MA/s), to take<br />
advantage of any preexisting<br />
WS-NCS associated<br />
with initial non-relaxed<br />
j-profiles. The ECH was<br />
applied off axis, before<br />
LHCD (P ECH ≈0.3 MW,<br />
r dep /a=0.2), thereby<br />
broadening the initial<br />
temperature and possibly<br />
triggering an off-axis<br />
LHCD. Figure <strong>1.</strong>2 shows<br />
the time evolution of the<br />
main plasma quantities.<br />
The LH power was<br />
injected in 100 ms in steps<br />
of just over 0.3 MW up to<br />
<strong>1.</strong>7 MW to compensate for the increasing electron density. In this way an electron ITB<br />
(L T<br />
-1 =20 m -1 , ρ T * >0.03) was sustained for more than 0.2 s (6-7 <strong>confinement</strong> times) well<br />
inside the current flat-top. In this phase the driven current fraction was I LH /I p ~50%,<br />
the central density increased up to n e0 ~0.8×10 20 m -3 , T e0 exceeded 11 keV, the ITB<br />
footprint expanded from r/a~ 0.3 to ≈0.4 and T i0 went from 1 to <strong>1.</strong>6 keV. The neutron<br />
yield also increased during the main ITB phase and was three times larger than in a<br />
reference Ohmic discharge. The ITB was terminated at t>0.34 s by an m=1 MHD<br />
tearing mode related to a change in the current density profile after ECH switch-off.<br />
The local transport analysis showed that, in the weak shear region, transport is<br />
indeed reduced during the main heating. However, the low plasma volume still<br />
involved implies that the global energy <strong>confinement</strong> time is generally in line with the<br />
ITER89-P scaling, although it exceeds the ITERL-thermal scaling.