1. magnetic confinement - ENEA - Fusione
1. magnetic confinement - ENEA - Fusione
1. magnetic confinement - ENEA - Fusione

Create successful ePaper yourself
Turn your PDF publications into a flip-book with our unique Google optimized e-Paper software.
<strong>1.</strong> MAGNETIC CONFINEMENT<br />
35<br />
[<strong>1.</strong>43] M. Talvard, G.<br />
Giruzzi and W. D. Liu,<br />
Proc. 19th EPS Conf. on<br />
Contr. Fusion and Plasma<br />
Physics (Innsbruck 1992)<br />
Vol. 16C, 1103 (1992)<br />
[<strong>1.</strong>44] S. Preische, P. C.<br />
Efthimion and S. M. Kaye,<br />
Rev. Sci. Instrum. 68,<br />
409 (1997)<br />
<strong>1.</strong>2 FTU Facilities<br />
Oblique ECE measurements were performed for the first time at FTU. At present, this<br />
is the only oblique ECE diagnostic installed in a fusion device, and the potential of<br />
such a diagnostic appears to be still largely untapped [<strong>1.</strong>43-<strong>1.</strong>44]. High-field<br />
operations on FTU and access to enhanced <strong>confinement</strong> regimes [<strong>1.</strong>42] allow this<br />
diagnostic to have an excellent resolution in configuration and velocity space. This<br />
capability can be exploited to determine the bulk form of the electron distribution<br />
and the transition from the bulk to the tail of the distribution. This would allow a<br />
detailed study of the kinetic processes involved in heating and current drive, in a<br />
variety of transport mechanisms for which at present direct experimental evidence is<br />
lacking.<br />
New data acquisition system for the plasma-density laser interferometer<br />
The two-colour interferometer was developed to get reliable density measurements<br />
during pellet injection experiments. To calculate the density, the signal from the CO 2<br />
detectors, the HgCdTe room-temperature photo resistor and HeNe photodiode has<br />
to be acquired, amplified with the automatic gain control and then compared with<br />
the signal taken from the Bragg cell driver.<br />
A new acquisition system based on a PC with a 5-MHz ADC was installed to increase<br />
the sampling rate of the old system. The system also processes, stores and sends the<br />
signal data and density to the main pulse file (based on the UNIX system) so that<br />
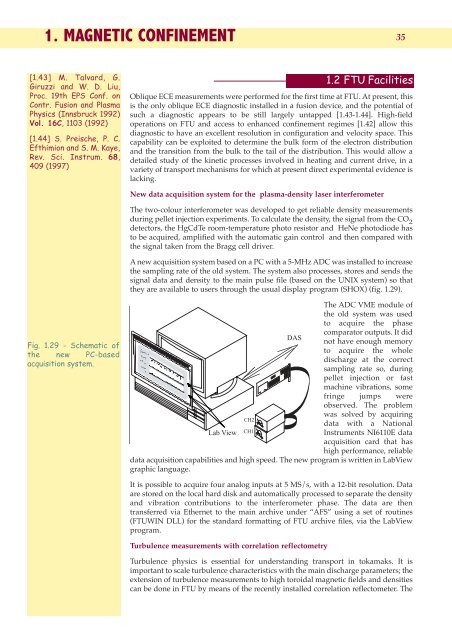
they are available to users through the usual display program (SHOX) (fig. <strong>1.</strong>29).<br />
Fig. <strong>1.</strong>29 - Schematic of<br />
the new PC-based<br />
acquisition system.<br />
The ADC VME module of<br />
the old system was used<br />
to acquire the phase<br />
DAS<br />
comparator outputs. It did<br />
not have enough memory<br />
to acquire the whole<br />
discharge at the correct<br />
sampling rate so, during<br />
pellet injection or fast<br />
machine vibrations, some<br />
fringe jumps were<br />
observed. The problem<br />
was solved by acquiring<br />
CH2<br />
data with a National<br />
Lab View CH1<br />
Instruments NI6110E data<br />
acquisition card that has<br />
high performance, reliable<br />
data acquisition capabilities and high speed. The new program is written in LabView<br />
graphic language.<br />
It is possible to acquire four analog inputs at 5 MS/s, with a 12-bit resolution. Data<br />
are stored on the local hard disk and automatically processed to separate the density<br />
and vibration contributions to the interferometer phase. The data are then<br />
transferred via Ethernet to the main archive under “AFS” using a set of routines<br />
(FTUWIN DLL) for the standard formatting of FTU archive files, via the LabView<br />
program.<br />
Turbulence measurements with correlation reflectometry<br />
Turbulence physics is essential for understanding transport in tokamaks. It is<br />
important to scale turbulence characteristics with the main discharge parameters; the<br />
extension of turbulence measurements to high toroidal <strong>magnetic</strong> fields and densities<br />
can be done in FTU by means of the recently installed correlation reflectometer. The