1. magnetic confinement - ENEA - Fusione
1. magnetic confinement - ENEA - Fusione
1. magnetic confinement - ENEA - Fusione

Create successful ePaper yourself
Turn your PDF publications into a flip-book with our unique Google optimized e-Paper software.
<strong>1.</strong> MAGNETIC CONFINEMENT<br />
39<br />
Coherency Cross-phase Amplitude<br />
π a.u.<br />
<strong>1.</strong>0<br />
0.5<br />
0.0<br />
1<br />
0<br />
<strong>1.</strong>0<br />
-1<br />
0.5<br />
0.0<br />
-100 -50 0 50 100<br />
Frequency kHz<br />
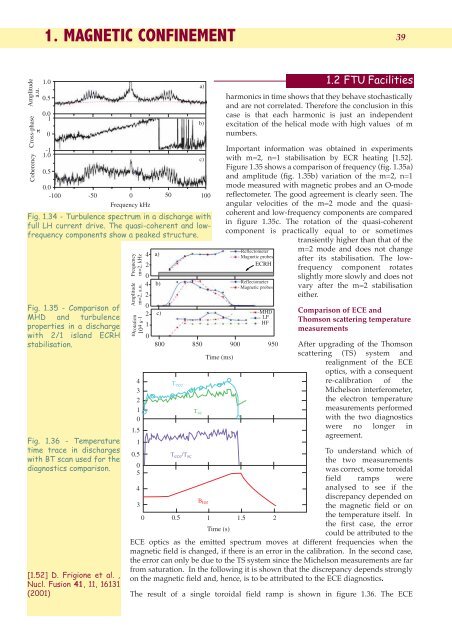
Fig. <strong>1.</strong>34 - Turbulence spectrum in a discharge with<br />
full LH current drive. The quasi-coherent and lowfrequency<br />
components show a peaked structure.<br />
Fig. <strong>1.</strong>35 - Comparison of<br />
MHD and turbulence<br />
properties in a discharge<br />
with 2/1 island ECRH<br />
stabilisation.<br />
Fig. <strong>1.</strong>36 - Temperature<br />
time trace in discharges<br />
with BT scan used for the<br />
diagnostics comparison.<br />
[<strong>1.</strong>52] D. Frigione et al. ,<br />
Nucl. Fusion 41, 11, 16131<br />
(2001)<br />
Frequency<br />
m=2, kHz<br />
Amplitude<br />
m=2, a.u.<br />
ωrotation<br />
104 s-1<br />
4<br />
3<br />
2<br />
1<br />
0<br />
<strong>1.</strong>5<br />
1<br />
0.5<br />
0<br />
5<br />
4<br />
3<br />
4<br />
2<br />
0<br />
4<br />
2<br />
0<br />
2<br />
1<br />
0<br />
a)<br />
b)<br />
c)<br />
800<br />
T ece<br />
a)<br />
b)<br />
c)<br />
850<br />
T ece /T sc<br />
T sc<br />
B tor<br />
Time (ms)<br />
<strong>1.</strong>2 FTU Facilities<br />
harmonics in time shows that they behave stochastically<br />
and are not correlated. Therefore the conclusion in this<br />
case is that each harmonic is just an independent<br />
excitation of the helical mode with high values of m<br />
numbers.<br />
Important information was obtained in experiments<br />
with m=2, n=1 stabilisation by ECR heating [<strong>1.</strong>52].<br />
Figure <strong>1.</strong>35 shows a comparison of frequency (fig. <strong>1.</strong>35a)<br />
and amplitude (fig. <strong>1.</strong>35b) variation of the m=2, n=1<br />
mode measured with <strong>magnetic</strong> probes and an O-mode<br />
reflectometer. The good agreement is clearly seen. The<br />
angular velocities of the m=2 mode and the quasicoherent<br />
and low-frequency components are compared<br />
in figure <strong>1.</strong>35c. The rotation of the quasi-coherent<br />
component is practically equal to or sometimes<br />
transiently higher than that of the<br />
900<br />
Reflectometer<br />
Magnetic probes<br />
ECRH<br />
Reflectometer<br />
Magnetic probes<br />
MHD<br />
LF<br />
HF<br />
950<br />
0 0.5 1 <strong>1.</strong>5 2<br />
Time (s)<br />
m=2 mode and does not change<br />
after its stabilisation. The lowfrequency<br />
component rotates<br />
slightly more slowly and does not<br />
vary after the m=2 stabilisation<br />
either.<br />
Comparison of ECE and<br />
Thomson scattering temperature<br />
measurements<br />
After upgrading of the Thomson<br />
scattering (TS) system and<br />
realignment of the ECE<br />
optics, with a consequent<br />
re-calibration of the<br />
Michelson interferometer,<br />
the electron temperature<br />
measurements performed<br />
with the two diagnostics<br />
were no longer in<br />
agreement.<br />
To understand which of<br />
the two measurements<br />
was correct, some toroidal<br />
field ramps were<br />
analysed to see if the<br />
discrepancy depended on<br />
the <strong>magnetic</strong> field or on<br />
the temperature itself. In<br />
the first case, the error<br />
could be attributed to the<br />
ECE optics as the emitted spectrum moves at different frequencies when the<br />
<strong>magnetic</strong> field is changed, if there is an error in the calibration. In the second case,<br />
the error can only be due to the TS system since the Michelson measurements are far<br />
from saturation. In the following it is shown that the discrepancy depends strongly<br />
on the <strong>magnetic</strong> field and, hence, is to be attributed to the ECE diagnostics.<br />
The result of a single toroidal field ramp is shown in figure <strong>1.</strong>36. The ECE