1. magnetic confinement - ENEA - Fusione
1. magnetic confinement - ENEA - Fusione
1. magnetic confinement - ENEA - Fusione

You also want an ePaper? Increase the reach of your titles
YUMPU automatically turns print PDFs into web optimized ePapers that Google loves.
<strong>1.</strong> MAGNETIC CONFINEMENT<br />
37<br />
[<strong>1.</strong>48] F. Alladio et al.,<br />
Pressure Anisotropy in<br />
Ohmic FTU Discharges,<br />
presented at the 18 th<br />
European Conf. on Control.<br />
Fusion and Plasma Physics,<br />
(Berlin 1991)<br />
[<strong>1.</strong>49] V.A. Vershkov, et<br />
al., Nucl. Fusion, Iokohama<br />
special issue 2, IAEA, 39,<br />
1775 (1999)<br />
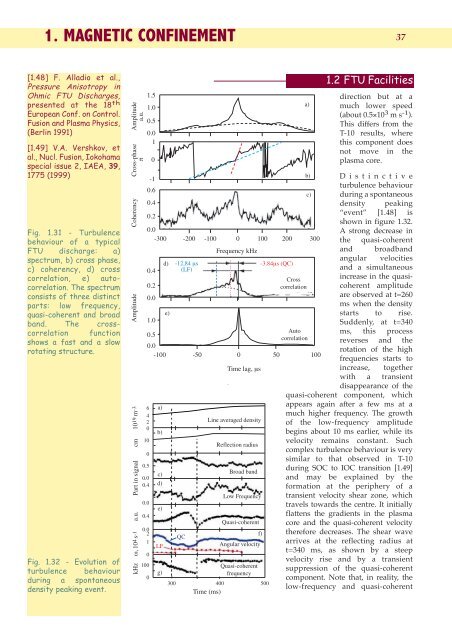
Fig. <strong>1.</strong>31 - Turbulence<br />
behaviour of a typical<br />
FTU discharge: a)<br />
spectrum, b) cross phase,<br />
c) coherency, d) cross<br />
correlation, e) autocorrelation.<br />
The spectrum<br />
consists of three distinct<br />
parts: low frequency,<br />
quasi-coherent and broad<br />
band. The crosscorrelation<br />
function<br />
shows a fast and a slow<br />
rotating structure.<br />
Fig. <strong>1.</strong>32 - Evolution of<br />
turbulence behaviour<br />
during a spontaneous<br />
density peaking event.<br />
Coherency Cross-phase Amplitude<br />
π<br />
a.u.<br />
Amplitude<br />
kHz ω, 104 s-1 a.u. Part in signal cm 1019 m-3<br />
<strong>1.</strong>5<br />
<strong>1.</strong>0<br />
0.5<br />
0.0<br />
1<br />
0.6<br />
0.4<br />
0.2<br />
0.0<br />
-300 -200 -100 0 100 200<br />
0.4<br />
0.2<br />
0.0<br />
<strong>1.</strong>0<br />
0.5<br />
0.0<br />
-100<br />
6<br />
4<br />
2<br />
0<br />
10<br />
0<br />
0.5<br />
0.0<br />
0.4<br />
0.0<br />
0.4<br />
0.0 2<br />
1<br />
0<br />
100<br />
0<br />
0<br />
-1<br />
a)<br />
b)<br />
c)<br />
d)<br />
e)<br />
LF<br />
g)<br />
d)<br />
d)<br />
e)<br />
-12,84 µs<br />
(LF)<br />
QC<br />
-50<br />
300 400<br />
Time (ms)<br />
Frequency kHz<br />
0 50<br />
Time lag, µs<br />
i<br />
Line averaged density<br />
Reflection radius<br />
Broad band<br />
Low Frequency<br />
Quasi-coherent<br />
Angular velocity<br />
Quasi-coherent<br />
frequency<br />
f)<br />
-3.84µs (QC)<br />
500<br />
a)<br />
b)<br />
Cross<br />
correlation<br />
c) c)<br />
Auto<br />
correlation<br />
300<br />
100<br />
<strong>1.</strong>2 FTU Facilities<br />
direction but at a<br />
much lower speed<br />
(about 0.5×10 3 m s -1 ).<br />
This differs from the<br />
T-10 results, where<br />
this component does<br />
not move in the<br />
plasma core.<br />
Distinctive<br />
turbulence behaviour<br />
during a spontaneous<br />
density peaking<br />
“event” [<strong>1.</strong>48] is<br />
shown in figure <strong>1.</strong>32.<br />
A strong decrease in<br />
the quasi-coherent<br />
and broadband<br />
angular velocities<br />
and a simultaneous<br />
increase in the quasicoherent<br />
amplitude<br />
are observed at t=260<br />
ms when the density<br />
starts to rise.<br />
Suddenly, at t=340<br />
ms, this process<br />
reverses and the<br />
rotation of the high<br />
frequencies starts to<br />
increase, together<br />
with a transient<br />
disappearance of the<br />
quasi-coherent component, which<br />
appears again after a few ms at a<br />
much higher frequency. The growth<br />
of the low-frequency amplitude<br />
begins about 10 ms earlier, while its<br />
velocity remains constant. Such<br />
complex turbulence behaviour is very<br />
similar to that observed in T-10<br />
during SOC to IOC transition [<strong>1.</strong>49]<br />
and may be explained by the<br />
formation at the periphery of a<br />
transient velocity shear zone, which<br />
travels towards the centre. It initially<br />
flattens the gradients in the plasma<br />
core and the quasi-coherent velocity<br />
therefore decreases. The shear wave<br />
arrives at the reflecting radius at<br />
t=340 ms, as shown by a steep<br />
velocity rise and by a transient<br />
suppression of the quasi-coherent<br />
component. Note that, in reality, the<br />
low-frequency and quasi-coherent