1. magnetic confinement - ENEA - Fusione
1. magnetic confinement - ENEA - Fusione
1. magnetic confinement - ENEA - Fusione

Create successful ePaper yourself
Turn your PDF publications into a flip-book with our unique Google optimized e-Paper software.
<strong>1.</strong> MAGNETIC CONFINEMENT<br />
33<br />
<strong>1.</strong>2 FTU Facilities<br />
emitted by the plasma, can be steered at different toroidal angles (φ=0˚, ±10˚, ±20˚,<br />
±30˚, with respect to the normal direction) and can also perform a continuous<br />
poloidal scan. Due to the narrow frequency range of the radiometer (247-287 GHz),<br />
observation of the plasma centre during on-axis ECH is possible only for φ=0° and<br />
±10°.<br />
In order to minimise the amount of O-mode radiation reaching the radiometer for<br />
oblique viewing, a polariser was installed in front of the antenna. The polariser is a<br />
quarter-wave plate, whose optical axis can be rotated to compensate for the change<br />
in polarisation of the X-mode when the observation angle is changed. For these<br />
preliminary measurements, the polariser is not a perfect quarter wave device and<br />
therefore conversion of the X-mode elliptical polarisation into linear is not complete.<br />
It was estimated that, for measurements at φ=±10°, the polariser reduces the<br />
contribution of the O-mode emission from 15% to 4%.<br />
[<strong>1.</strong>40] P. Buratti and M.<br />
Zerbini, Rev. Sci. Instrum.<br />
66, 4208 (1995)<br />
[<strong>1.</strong>41] O. Tudisco et al.,<br />
Rev. Sci. Instrum. 67,<br />
3108 (1996)<br />
[<strong>1.</strong>42] P. Buratti et al.,<br />
Phys. Rev. Lett. 82, 560<br />
(1999)<br />
Two other ECE systems are routinely used on FTU: an absolutely calibrated<br />
Michelson interferometer that measures the ECE spectrum over five harmonics with<br />
moderate temporal resolution (5 ms) [<strong>1.</strong>40] and a 12-channel grating polychromator<br />
with a 10-ms time resolution [<strong>1.</strong>41]. Both spectrometers measure the emission with<br />
the line of sight in the mid-plane, normal to the <strong>magnetic</strong> field.<br />
The radiometer has better spatial resolution (∆r≈±1 cm, ∆z≈±<strong>1.</strong>8 cm) than the<br />
interferometer (∆r≈±2.5 cm, ∆z≈±2 cm) and polychromator. This difference is<br />
appreciable in the presence of peaked temperature profiles, like those discussed here.<br />
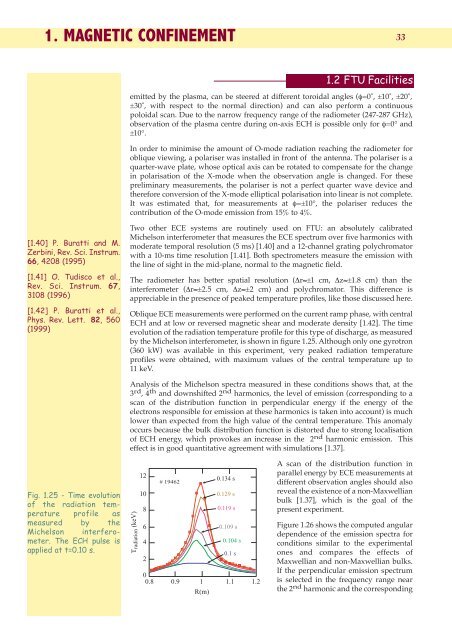
Oblique ECE measurements were performed on the current ramp phase, with central<br />
ECH and at low or reversed <strong>magnetic</strong> shear and moderate density [<strong>1.</strong>42]. The time<br />
evolution of the radiation temperature profile for this type of discharge, as measured<br />
by the Michelson interferometer, is shown in figure <strong>1.</strong>25. Although only one gyrotron<br />
(360 kW) was available in this experiment, very peaked radiation temperature<br />
profiles were obtained, with maximum values of the central temperature up to<br />
11 keV.<br />
Analysis of the Michelson spectra measured in these conditions shows that, at the<br />
3 rd , 4 th and downshifted 2 nd harmonics, the level of emission (corresponding to a<br />
scan of the distribution function in perpendicular energy if the energy of the<br />
electrons responsible for emission at these harmonics is taken into account) is much<br />
lower than expected from the high value of the central temperature. This anomaly<br />
occurs because the bulk distribution function is distorted due to strong localisation<br />
of ECH energy, which provokes an increase in the 2 nd harmonic emission. This<br />
effect is in good quantitative agreement with simulations [<strong>1.</strong>37].<br />
Fig. <strong>1.</strong>25 - Time evolution<br />
of the radiation temperature<br />
profile as<br />
measured by the<br />
Michelson interferometer.<br />
The ECH pulse is<br />
applied at t=0.10 s.<br />
Tradiation (keV)<br />
12<br />
# 19462<br />
0.134 s<br />
10<br />
0.129 s<br />
8<br />
6<br />
4<br />
2<br />
0.119 s<br />
0.109 s<br />
0.104 s<br />
0.1 s<br />
0<br />
0.8 0.9 1 <strong>1.</strong>1 <strong>1.</strong>2<br />
R(m)<br />
A scan of the distribution function in<br />
parallel energy by ECE measurements at<br />
different observation angles should also<br />
reveal the existence of a non-Maxwellian<br />
bulk [<strong>1.</strong>37], which is the goal of the<br />
present experiment.<br />
Figure <strong>1.</strong>26 shows the computed angular<br />
dependence of the emission spectra for<br />
conditions similar to the experimental<br />
ones and compares the effects of<br />
Maxwellian and non-Maxwellian bulks.<br />
If the perpendicular emission spectrum<br />
is selected in the frequency range near<br />
the 2 nd harmonic and the corresponding