Download - MyWeb - Texas Tech University
Download - MyWeb - Texas Tech University
Download - MyWeb - Texas Tech University

You also want an ePaper? Increase the reach of your titles
YUMPU automatically turns print PDFs into web optimized ePapers that Google loves.
The 2012 Season of the Chan Chich Archaeological Project<br />
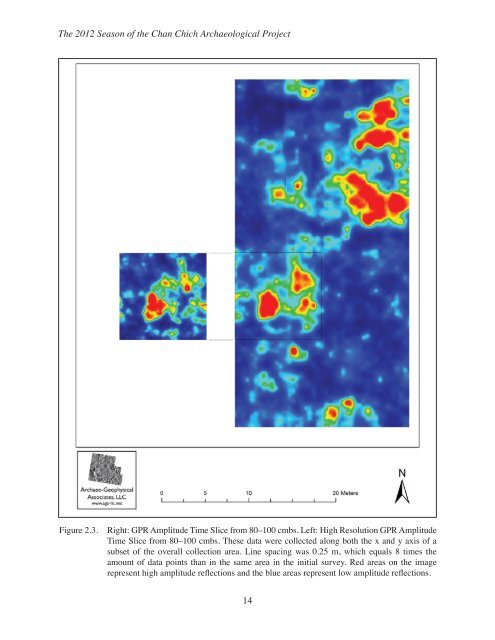
Figure 2.3.<br />
Right: GPR Amplitude Time Slice from 80–100 cmbs. Left: High Resolution GPR Amplitude<br />
Time Slice from 80–100 cmbs. These data were collected along both the x and y axis of a<br />
subset of the overall collection area. Line spacing was 0.25 m, which equals 8 times the<br />
amount of data points than in the same area in the initial survey. Red areas on the image<br />
represent high amplitude reflections and the blue areas represent low amplitude reflections.<br />
14