Reply SpA
Reply SpA
Reply SpA

Create successful ePaper yourself
Turn your PDF publications into a flip-book with our unique Google optimized e-Paper software.
Consolidated financial statements as at December 31, 2010<br />
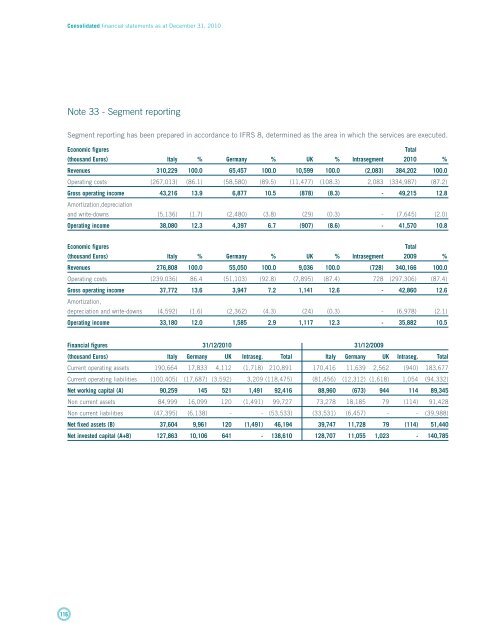
Note 33 - Segment reporting<br />
Segment reporting has been prepared in accordance to IFRS 8, determined as the area in which the services are executed.<br />
Economic figures<br />
Total<br />
(thousand Euros) Italy % Germany % UK % Intrasegment 2010 %<br />
Revenues 310,229 100.0 65,457 100.0 10,599 100.0 (2,083) 384,202 100.0<br />
Operating costs (267,013) (86.1) (58,580) (89.5) (11,477) (108.3) 2,083 (334,987) (87.2)<br />
Gross operating income 43,216 13.9 6,877 10.5 (878) (8.3) - 49,215 12.8<br />
Amortization,depreciation<br />
and write-downs (5,136) (1.7) (2,480) (3.8) (29) (0.3) - (7,645) (2.0)<br />
Operating income 38,080 12.3 4,397 6.7 (907) (8.6) - 41,570 10.8<br />
Economic figures<br />
Total<br />
(thousand Euros) Italy % Germany % UK % Intrasegment 2009 %<br />
Revenues 276,808 100.0 55,050 100.0 9,036 100.0 (728) 340,166 100.0<br />
Operating costs (239,036) 86.4 (51,103) (92.8) (7,895) (87.4) 728 (297,306) (87.4)<br />
Gross operating income 37,772 13.6 3,947 7.2 1,141 12.6 - 42,860 12.6<br />
Amortization,<br />
depreciation and write-downs (4,592) (1.6) (2,362) (4.3) (24) (0.3) - (6,978) (2.1)<br />
Operating income 33,180 12.0 1,585 2.9 1,117 12.3 - 35,882 10.5<br />
Financial figures 31/12/2010 31/12/2009<br />
(thousand Euros) Italy Germany UK Intraseg. Total Italy Germany UK Intraseg. Total<br />
Current operating assets 190,664 17,833 4,112 (1,718) 210,891 170,416 11,639 2,562 (940) 183,677<br />
Current operating liabilities (100,405) (17,687) (3,592) 3,209 (118,475) (81,456) (12,312) (1,618) 1,054 (94,332)<br />
Net working capital (A) 90,259 145 521 1,491 92,416 88,960 (673) 944 114 89,345<br />
Non current assets 84,999 16,099 120 (1,491) 99,727 73,278 18,185 79 (114) 91,428<br />
Non current liabilities (47,395) (6,138) - - (53,533) (33,531) (6,457) - - (39,988)<br />
Net fixed assets (B) 37,604 9,961 120 (1,491) 46,194 39,747 11,728 79 (114) 51,440<br />
Net invested capital (A+B) 127,863 10,106 641 - 138,610 128,707 11,055 1,023 - 140,785<br />
116