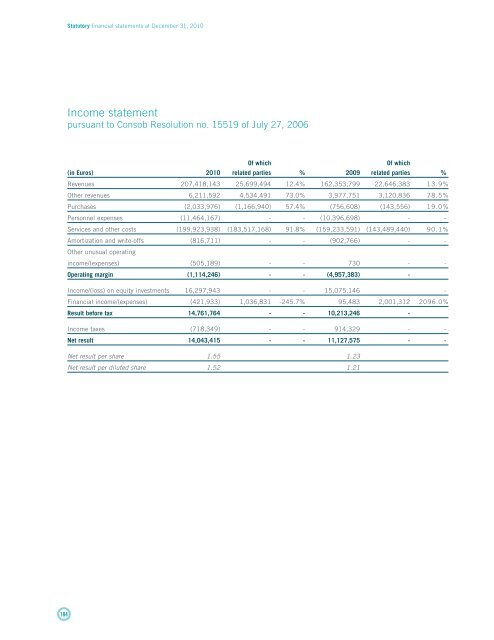
Statutory financial statements at December 31, 2010 Income statement pursuant to Consob Resolution no. 15519 of July 27, 2006 Of which Of which (in Euros) 2010 related parties % 2009 related parties % Revenues 207,418,143 25,699,494 12.4% 162,353,799 22,646,383 13.9% Other revenues 6,211,592 4,534,491 73.0% 3,977,751 3,120,836 78.5% Purchases (2,033,976) (1,166,940) 57.4% (756,608) (143,556) 19.0% Personnel expenses (11,464,167) - - (10,396,698) - - Services and other costs (199,923,938) (183,517,168) 91.8% (159,233,591) (143,489,440) 90.1% Amortization and write-offs (816,711) - - (902,766) - - Other unusual operating income/(expenses) (505,189) - - 730 - - Operating margin (1,114,246) - - (4,957,383) - Income/(loss) on equity investments 16,297,943 - - 15,075,146 - Financial income/(expenses) (421,933) 1,036,831 -245.7% 95,483 2,001,312 2096.0% Result before tax 14,761,764 - - 10,213,246 - Income taxes (718,349) - - 914,329 - - Net result 14,043,415 - - 11,127,575 - - Net result per share 1.55 1.23 Net result per diluted share 1.52 1.21 _ 184
Income statement Statement of comprehensive income Statement of financial position Statement of changes in equity Statement of cash flows Notes to the financial statements Annexed tables Statement of financial position pursuant to Consob Resolution no. 15519 of July 27, 2006 Of which Of which (in Euros) 31/12/2010 related parties % 31/12/2009 related parties % Tangible fixed assets 302,688 - - 541,437 - - Goodwill 86,765 - - 86,765 - - Other intangible assets 1,174,776 - - 1,331,854 - - Equity investments 107,025,969 - - 88,649,751 - - Financial assets 3,157,059 3,000,000 95.0% 1,535,573 1,450,000 94.4% Deferred tax assets 771,725 - 608,105 - - Non current assets 112,518,982 - - 92,753,485 Trade receivables 118,780,312 22,854,254 19.2% 116,098,489 33,103,303 28.5% Other receivables and current assets 31,011,598 25,676,000 82.8% 14,414,491 10,460,000 72.6% Financial assets 36,182,079 36,182,079 100.0% 37,699,565 37,699,565 100.0% Cash and cash equivalents 24,687,731 - - 10,758,268 - - Current assets 210,661,720 - - 178,970,813 - - TOTAL ASSETS 323,180,702 - - 271,724,298 - - Share capital 4,795,886 - - 4,795,886 - - Other reserves 85,216,130 - - 77,601,610 - - Net result 14,043,415 - - 11,127,575 - - Shareholders' equity 104,055,431 - - 93,525,071 - Payables to minority shareholders 12,895,016 - - - - - Financial liabilities 9,267,486 - - 15,962,667 - - Employee benefits 490,741 - - 562,424 - - Deferred tax liabilities 319,879 - - 286,908 - - Non current liabilities 22,973,122 - - 16,811,999 - - Financial liabilities 47,469,873 12,191,362 25.7% 35,233,097 19,519,133 55.4% Trade payables 127,560,467 123,199,445 96.6% 117,864,555 111,610,777 94.7% Other payables and current liabilities 20,621,809 2,885,718 14.0% 8,289,576 1,408,225 17.0% Provisions 500,000 - - - - Current liabilities 196,152,149 - - 161,387,228 - - TOTAL LIABILITIES 219,125,271 - - 178,199,227 - - TOTAL SHAREHOLDERS’ EQUITY AND LIABILITIES 323,180,702 - - 271,724,298 - - 185