Watershed Protection Plan - Lower Rio Grande Valley Development ...
Watershed Protection Plan - Lower Rio Grande Valley Development ...
Watershed Protection Plan - Lower Rio Grande Valley Development ...

Create successful ePaper yourself
Turn your PDF publications into a flip-book with our unique Google optimized e-Paper software.
MEASURING PROGRESS<br />
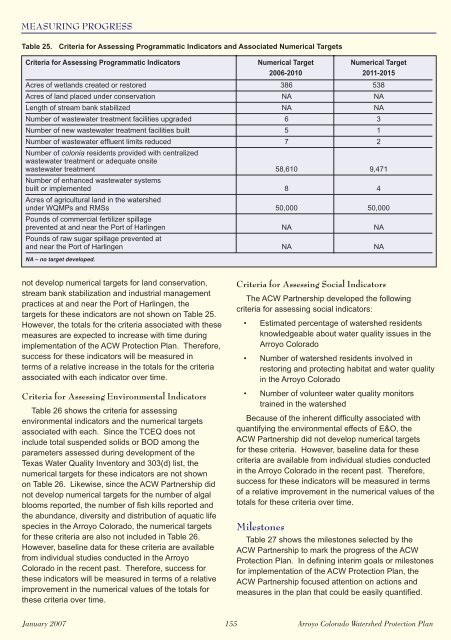
Table 25. Criteria for Assessing Programmatic Indicators and Associated Numerical Targets<br />
Criteria for Assessing Programmatic Indicators Numerical Target Numerical Target<br />
2006-2010 2011-2015<br />
Acres of wetlands created or restored 386 538<br />
Acres of land placed under conservation NA NA<br />
Length of stream bank stabilized NA NA<br />
Number of wastewater treatment facilities upgraded 6 3<br />
Number of new wastewater treatment facilities built 5 1<br />
Number of wastewater effl uent limits reduced 7 2<br />
Number of colonia residents provided with centralized<br />
wastewater treatment or adequate onsite<br />
wastewater treatment 58,610 9,471<br />
Number of enhanced wastewater systems<br />
built or implemented 8 4<br />
Acres of agricultural land in the watershed<br />
under WQMPs and RMSs 50,000 50,000<br />
Pounds of commercial fertilizer spillage<br />
prevented at and near the Port of Harlingen NA NA<br />
Pounds of raw sugar spillage prevented at<br />
and near the Port of Harlingen NA NA<br />
NA – no target developed.<br />
not develop numerical targets for land conservation,<br />
stream bank stabilization and industrial management<br />
practices at and near the Port of Harlingen, the<br />
targets for these indicators are not shown on Table 25.<br />
However, the totals for the criteria associated with these<br />
measures are expected to increase with time during<br />
implementation of the ACW <strong>Protection</strong> <strong>Plan</strong>. Therefore,<br />
success for these indicators will be measured in<br />
terms of a relative increase in the totals for the criteria<br />
associated with each indicator over time.<br />
Criteria for Assessing Environmental Indicators<br />
Table 26 shows the criteria for assessing<br />
environmental indicators and the numerical targets<br />
associated with each. Since the TCEQ does not<br />
include total suspended solids or BOD among the<br />
parameters assessed during development of the<br />
Texas Water Quality Inventory and 303(d) list, the<br />
numerical targets for these indicators are not shown<br />
on Table 26. Likewise, since the ACW Partnership did<br />
not develop numerical targets for the number of algal<br />
blooms reported, the number of fi sh kills reported and<br />
the abundance, diversity and distribution of aquatic life<br />
species in the Arroyo Colorado, the numerical targets<br />
for these criteria are also not included in Table 26.<br />
However, baseline data for these criteria are available<br />
from individual studies conducted in the Arroyo<br />
Colorado in the recent past. Therefore, success for<br />
these indicators will be measured in terms of a relative<br />
improvement in the numerical values of the totals for<br />
these criteria over time.<br />
Criteria for Assessing Social Indicators<br />
The ACW Partnership developed the following<br />
criteria for assessing social indicators:<br />
• Estimated percentage of watershed residents<br />
knowledgeable about water quality issues in the<br />
Arroyo Colorado<br />
• Number of watershed residents involved in<br />
restoring and protecting habitat and water quality<br />
in the Arroyo Colorado<br />
• Number of volunteer water quality monitors<br />
trained in the watershed<br />
Because of the inherent diffi culty associated with<br />
quantifying the environmental effects of E&O, the<br />
ACW Partnership did not develop numerical targets<br />
for these criteria. However, baseline data for these<br />
criteria are available from individual studies conducted<br />
in the Arroyo Colorado in the recent past. Therefore,<br />
success for these indicators will be measured in terms<br />
of a relative improvement in the numerical values of the<br />
totals for these criteria over time.<br />
Milestones<br />
Table 27 shows the milestones selected by the<br />
ACW Partnership to mark the progress of the ACW<br />
<strong>Protection</strong> <strong>Plan</strong>. In defi ning interim goals or milestones<br />
for implementation of the ACW <strong>Protection</strong> <strong>Plan</strong>, the<br />
ACW Partnership focused attention on actions and<br />
measures in the plan that could be easily quantifi ed.<br />
January 2007 155 Arroyo Colorado <strong>Watershed</strong> <strong>Protection</strong> <strong>Plan</strong>