Maersk Line presentation
Maersk Line presentation
Maersk Line presentation
You also want an ePaper? Increase the reach of your titles
YUMPU automatically turns print PDFs into web optimized ePapers that Google loves.
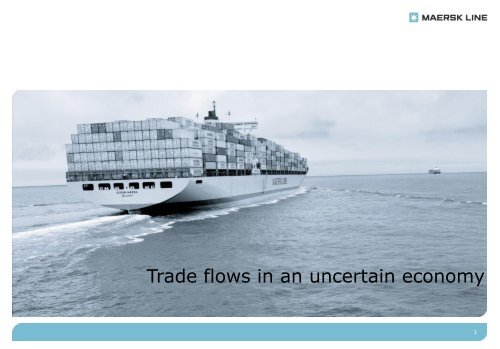
Trade flows in an uncertain economy<br />
1
Presenter<br />
Soren Andersen<br />
> Vice President, Fleet Management, <strong>Maersk</strong> <strong>Line</strong>, A.P. Moller – <strong>Maersk</strong> A/S<br />
> 12 years with A.P. Moller – <strong>Maersk</strong> A/S<br />
> Background in broking, tanker and offshore divisions<br />
> M.Sc. in Business Administration<br />
> 38 years old<br />
> Wife and three children<br />
<strong>Maersk</strong> <strong>Line</strong> Fleet Management includes chartering container vessels, sale & purchase<br />
of container vessels incl. newbuildings, global bunker exposure, operation of own and<br />
chartered vessels<br />
2
Agenda<br />
<strong>Maersk</strong> <strong>Line</strong> - status<br />
Economic crisis – effect on container shipping industry<br />
Super-slow steaming as an industry concept<br />
Developments in sea-freight, port infrastructure and intermodal network in Europe<br />
Q&A<br />
3
The size of container related activities - 2009<br />
> Over 100,000 customers globally<br />
> More than 325 offices in 125 countries<br />
> 22,000 employees world-wide<br />
> <strong>Maersk</strong> container shipping and related<br />
activities generated a total revenue of USD<br />
9.8 billion and a net loss of USD 961 million<br />
in H1 2009<br />
> More than 500 operated vessels<br />
> A container fleet of more than 1.9 million<br />
container units<br />
4
Age (Years)<br />
CSAV<br />
Hamburg Sud<br />
OOCL<br />
Hanjin<br />
<strong>Maersk</strong> <strong>Line</strong><br />
Hyundai<br />
CMA CGM<br />
K <strong>Line</strong><br />
PIL<br />
Yang Ming<br />
MOL<br />
APL<br />
Wan Hai<br />
NYK<br />
Hapag Lloyd<br />
CSCL<br />
Zim<br />
Evergreen<br />
COSCO<br />
MSC<br />
Capcity (TEU)<br />
<strong>Maersk</strong> <strong>Line</strong>’s current fleet is modern compared to<br />
competitors<br />
18.0<br />
16.0<br />
14.0<br />
12.0<br />
10.0<br />
2,500,000<br />
2,000,000<br />
1,500,000<br />
8.0<br />
6.0<br />
4.0<br />
2.0<br />
1,000,000<br />
500,000<br />
0.0<br />
Fleet Age<br />
Capacity (TEU)<br />
Source: AXS-Alphaliner<br />
5
Thousands<br />
TEU<br />
APM-<strong>Maersk</strong><br />
Mediterranean<br />
Shg Co<br />
CMA CGM<br />
Group<br />
Evergreen<br />
<strong>Line</strong><br />
Hapag-Lloyd<br />
COSCO<br />
Container L.<br />
APL<br />
CSCL<br />
NYK<br />
Hanjin /<br />
Senator<br />
<strong>Maersk</strong> <strong>Line</strong> has a smaller vessel order book than<br />
most competitors<br />
Top 10 Container operators<br />
3000<br />
2500<br />
2000<br />
Orderbook TEU<br />
Chartered TEU<br />
Owned TEU<br />
1500<br />
1000<br />
500<br />
0<br />
Source: AXS Alphaliner<br />
6
<strong>Maersk</strong> <strong>Line</strong> is the most reliable among the 30 largest carriers<br />
80%<br />
75%<br />
70%<br />
65%<br />
60%<br />
55%<br />
50%<br />
45%<br />
40%<br />
35%<br />
30%<br />
APM-<strong>Maersk</strong><br />
Hapag-Lloyd<br />
NYK<br />
OOCL<br />
Hamburg Süd Group<br />
Hyundai M.M.<br />
APL<br />
UASC<br />
Evergreen <strong>Line</strong><br />
CSAV Group<br />
MOL<br />
CMA CGM Group<br />
Zim<br />
CSCL<br />
Mediterranean Shg Co<br />
Yang Ming <strong>Line</strong><br />
Hanjin Shipping<br />
K <strong>Line</strong><br />
COSCO Container L.<br />
PIL (Pacific Int. <strong>Line</strong>)<br />
Arrivals noted as being on-time<br />
Source: Drewry Schedule Reliability 2Q2009, Measured for January-March 2009<br />
7
Agenda<br />
<strong>Maersk</strong> <strong>Line</strong> - status<br />
Economic crisis – effect on container shipping industry<br />
Super-slow steaming as an industry concept<br />
Developments in sea-freight, port infrastructure and intermodal network in Europe<br />
Q&A<br />
8
Global Container Demand is expected to bounce back but modest or<br />
no growth anticipated for 2010<br />
19.0%<br />
14.0%<br />
9.0%<br />
4.0%<br />
0.0%<br />
-2.0%<br />
-4.0%<br />
-6.0%<br />
-8.0%<br />
2009 Quarterly Demand Growth<br />
Q4 2008 Q1 2009 Q2 2009 Q3 2009 Q4 2009<br />
-1.0%<br />
-6.0%<br />
-11.0%<br />
2001 2002 2003 2004 2005 2006 2007 2008 2009 2010<br />
Drewry Clarkson Global Insight<br />
-10.0%<br />
-12.0%<br />
-14.0%<br />
-16.0%<br />
Drewry 2009 Q2<br />
Contraction in 2009 container demand seen for the first time since 1980 – 2009 contraction of<br />
~10% vis a vis trend growth of +9% (1980-2008)<br />
According to Drewry, Q1 2009 saw the trough of the demand decline but recovery to be slow<br />
2010 demand expected to end up on a marginally positive note based on slow recovery of the<br />
global economy<br />
9
Capacity Growth is expected to drop in 2009 and 2010<br />
18.0%<br />
16.0%<br />
14.0%<br />
12.0%<br />
10.0%<br />
8.0%<br />
6.0%<br />
4.0%<br />
2001 2002 2003 2004 2005 2006 2007 2008 2009 2010 2011<br />
Drewry<br />
Clarkson<br />
Zero orders placed in the last eight months with expectations of ordering activity not to pick up any<br />
time soon<br />
Given significant contraction in demand in 2009 and marginal growth in 2010, industry set for<br />
overcapacity situation this year and the next<br />
Lay up of vessels/slow steaming likely to be a capacity modifier – current estimates from AXS-<br />
Alphaliner show that 1.3 million TEU equalling 10.4% of current fleet is idle<br />
10
Lack of demand and increasing supply - long term concerning<br />
11
Industry Mitigating Actions<br />
• Current level of freight rate increases<br />
insufficient<br />
• Network rationalisation – adjusting capacity to<br />
the low demand level<br />
• Slow steaming will help absorb capacity as<br />
well as save bunker costs<br />
12
Agenda<br />
<strong>Maersk</strong> <strong>Line</strong> – status<br />
Economic crisis – effect on container shipping industry<br />
Super-slow steaming as an industry concept<br />
Developments in sea-freight, port infrastructure and intermodal network in Europe<br />
Q&A<br />
13
Consumption (ton/day)<br />
Reducing engine load dramatically decreases fuel consumption<br />
185<br />
> Fuel consumption and CO 2 emissions increase<br />
exponentially with speed<br />
> Going at full throttle is not economically or<br />
ecologically optimal<br />
165<br />
145<br />
125<br />
105<br />
85<br />
65<br />
Medium size<br />
vessel of<br />
8,000 TEU<br />
45<br />
25<br />
12 15 18 21<br />
Speed (kn)<br />
24<br />
14
In 2008, <strong>Maersk</strong> <strong>Line</strong> led the way by slow steaming<br />
> We were at the spearhead of the industry when we slowed down our vessels during 2008<br />
> We successfully reduced the<br />
> economic impact of dramatically increased<br />
fuel prices<br />
Slow<br />
Regular<br />
> ecological impact of our operations<br />
Fuel and CO 2 savings:<br />
14% per vessel<br />
10% per service<br />
18 kn 20 kn<br />
40%<br />
60%<br />
Super<br />
Slow<br />
14 kn 24 kn<br />
10% 90%<br />
Full<br />
* Based on medium sized 8,000 TEU vessel<br />
kn = knots / % of engine load<br />
15
Further slowing down seemed impossible<br />
> Manufacturers traditionally design vessel engines<br />
for high speed<br />
Slow<br />
Regular<br />
> Further reduced engine load below 40% and<br />
consequently lower vessel speed was feared to<br />
damage engines<br />
18 kn 20 kn<br />
40%<br />
60%<br />
Super<br />
Slow<br />
14 kn 24 kn<br />
10% 90%<br />
Full<br />
* Based on medium sized 8,000 TEU vessel<br />
kn = knots / % of engine load<br />
16
We challenged these policies against all odds<br />
> In a tremendous effort, we have tested Super Slow Steaming<br />
> By research on 110 of our own vessels on trades across the world since 2007<br />
> We proved it was possible to go down as low as<br />
10% engine load - when applying expertise and<br />
constant care<br />
Slow<br />
Regular<br />
Fuel and CO 2 savings:<br />
43% per vessel<br />
30% per service<br />
18 kn 20 kn<br />
40%<br />
60%<br />
> This breakthrough means increased flexibility in<br />
choosing the right speed<br />
> We have convinced engine manufacturers to<br />
revise their instructions - for the benefit of the<br />
whole industry and our environment<br />
> For these efforts, we received the reputable<br />
award ‘Sustainable Shipping Operator 2009’<br />
Super<br />
Slow<br />
14 kn 24 kn<br />
10% 90%<br />
Full<br />
* Based on medium sized 8,000 TEU vessel<br />
kn = knots / % of engine load<br />
17
Add a vessel, save fuel<br />
> For many services, slow steaming requires one or<br />
two additional vessels to maintain the weekly<br />
schedule<br />
> Yes, we do increase our capital costs<br />
> But:<br />
> Even with additional vessels, we reduce the total<br />
fuel consumption and CO 2 emissions<br />
> On some services, this allows for more port calls<br />
> Without<br />
Super Slow Steaming<br />
8 vessels at 20 knots<br />
136,000 mt<br />
CO 2 *<br />
+<br />
> Possible with<br />
Super Slow Steaming<br />
10 vessels at 14 knots<br />
91,000 mt<br />
CO 2 *<br />
* Roundtrip Asia-Europe<br />
30% savings on fuel and CO 2 –<br />
even with additional vessels<br />
18
Agenda<br />
<strong>Maersk</strong> <strong>Line</strong> - status<br />
Economic crisis – effect on container shipping industry<br />
Super-slow steaming as an industry concept<br />
Developments in sea-freight, port infrastructure and intermodal network in Europe<br />
Q&A<br />
19
TEU ('000)<br />
Percentage<br />
Growth of sea-freight volume is expected to be sluggish – increase in<br />
demand for Intra-regional trades<br />
> 2010 volumes to remain at depressed<br />
2009 levels in key trade lanes<br />
> Steady but limited growth in Intra-<br />
European sea-borne containerised trade<br />
> Direct competition from rail companies,<br />
trucks, ro/ro and breakbulk<br />
> Long term, volume is anticipated to be<br />
converted into sea freight (and rail) due<br />
to focus on environment and European<br />
Commission initiatives (Marco Polo<br />
programme)<br />
> High oil price increases competitiveness<br />
of sea freight<br />
Intra-European seaborne trade forecast (2010-2014)<br />
10,000<br />
9,000<br />
8,000<br />
7,000<br />
6,000<br />
5,000<br />
4,000<br />
3,000<br />
2,000<br />
1,000<br />
0<br />
2010 2011 2012 2013 2014<br />
Year<br />
Source: Global Insight<br />
7%<br />
6%<br />
5%<br />
4%<br />
3%<br />
2%<br />
1%<br />
0%<br />
TEU<br />
Year-on-year growth<br />
20
Container terminal expansion is expected to be subdued in the near term<br />
> Recession is not expected to impact the position of the<br />
four global container terminal operators (Hutchison,<br />
PSA, APM Terminals and DP World) as they are better<br />
positioned to meet the needs of large containerships<br />
> Expansion plans are being shelved<br />
> Global container terminal operators are increasingly<br />
willing to cooperate e.g. Eurogate and APMT in Gioia<br />
Tauro and Bremerhaven, DP World and CMA CGM in Le<br />
Havre<br />
> Growth in capacity is not expected to return till 2011<br />
> The leading European projects are the Maasvlakte 2<br />
(Rotterdam, 2013, Port of Rotterdam) and London<br />
gateway project (north bank of the Thames River, DP<br />
World, 2011)<br />
London Gateway project<br />
21
TEU<br />
European container terminals are expected to be underutilised until<br />
2015. Capacity gap is expected to narrow from 2h2010<br />
> Terminal utilisation levels are anticipated to be subdued across Europe and are not expected<br />
to exceed 80-85% in Northern and 65-70% in Southern and Eastern Europe by 2014<br />
> Ocean carriers could start offloading their assets<br />
> Slower growth is hampering investments in higher risk areas i.e. Eastern Europe (throughput<br />
declined by 22% in 2009 and is anticipated to decline by another 10% in 2010)<br />
> Leading container operators are expected to add capacity to network by 2014, although<br />
cautious of future prospects.<br />
Northern Europe Forecast Terminal Supply & Demand Balance to 2015,<br />
base scenario<br />
100,000,000<br />
80,000,000<br />
Avg. supply growth (09-15): 4.2%<br />
60,000,000<br />
40,000,000<br />
20,000,000<br />
0<br />
2008 2009 2010 2011 2012 2013 2014 2015<br />
Avg. demand growth (09-15): 7%<br />
Reduction of free capacity from 16<br />
mill. TEU in 2009 to 7.7 mill. TEU in<br />
2014.<br />
Year<br />
Total Supply<br />
Total Demand<br />
22
Developments in European inland infrastructure will be driven by<br />
volume growth and focus on environmental issues<br />
> Implementation of new transport solutions hinge on trade<br />
growth - no significant infrastructure developments<br />
planned within 1-2 years<br />
> The European emerging markets to attract most of the<br />
investments aimed at improving infrastructure, partly<br />
subsidised by the European Union<br />
> In the long term, volume is anticipated to be converted to<br />
rail transport (and sea freight) due to growing focus on<br />
environmental issues as well as European Commission<br />
initiatives including Marco Polo<br />
23
In conclusion<br />
> The downturn is not expected to be short term.<br />
> The key trade lanes anticipate 2010 volumes to<br />
remain at the low 2009 levels.<br />
> Modest growth in Intra-European trade expected in<br />
2010<br />
> Many terminal expansion plans are being shelved<br />
24
Questions<br />
25


