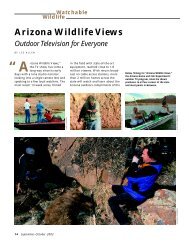
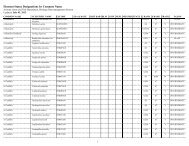
Table 59. Expenditures for <strong>Hunting</strong> by State Where Spending Took Place: <strong>2006</strong> (Population 16 years old <strong>and</strong> older. Expenditures in thous<strong>and</strong>s <strong>of</strong> dollars) State where spending took place Total expenditures Trip-related expenditures Expenditures for equipment Expenditures for Total triprelated Food <strong>and</strong> lodging Transportation Other trip costs Total equipment <strong>Hunting</strong> equipment Auxiliary equipment Special equipment other items 1 United States, total .... 22,893,156 6,678,614 2,791,245 2,696,924 1,190,445 10,731,501 5,366,357 1,330,216 4,034,928 5,483,041 Alabama ................ 678,024 239,398 82,577 84,777 72,045 315,894 151,297 40,510 *124,087 122,731 Alaska.................. 125,112 48,905 9,745 29,166 9,994 67,897 24,831 19,083 ... 8,310 Arizona ................ 322,739 92,363 33,599 39,386 19,377 219,641 61,155 17,977 ... 10,735 Arkansas ............... 788,575 182,192 81,047 73,257 27,889 375,236 191,180 55,862 *128,194 231,147 California .............. 813,239 230,873 88,210 104,256 38,407 428,493 152,902 38,964 ... 153,873 Colorado ................ 444,061 288,325 97,329 76,786 114,210 91,574 71,900 19,674 ... 64,162 Connecticut.............. 68,530 5,991 *1,782 3,558 *651 50,160 20,660 *4,162 ... 12,379 Delaware................ 41,381 13,638 5,477 4,832 *3,329 24,802 16,019 6,487 ... 2,941 Florida ................. 377,394 155,116 43,013 59,561 52,543 173,749 125,342 28,308 ... 48,528 Georgia ................ 677,762 237,162 96,620 84,652 55,890 209,233 121,722 30,372 ... 231,367 Hawaii ................. 21,098 10,736 5,410 4,469 *858 9,780 8,837 *943 ... 583 Idaho................... 259,718 100,218 37,974 40,986 21,259 121,708 54,161 *11,431 ... 37,792 Illinois ................. 381,937 130,466 47,128 47,761 35,578 129,180 77,291 39,188 ... 122,290 Indiana ................. 223,023 65,553 26,628 31,871 7,054 103,456 85,542 17,914 ... 54,015 Iowa ................... 288,324 110,756 43,895 49,582 *17,279 131,184 99,548 23,535 ... 46,384 Kansas ................. 248,674 121,162 52,847 58,116 10,199 95,175 78,056 15,970 ... 32,337 Kentucky ............... 423,439 83,591 38,019 41,503 4,069 208,270 143,802 29,785 ... 131,578 Louisiana ............... 525,505 205,355 83,297 73,628 48,429 206,072 114,697 23,285 ... 114,078 Maine .................. 241,301 58,997 29,704 25,774 3,519 110,898 33,779 15,174 ... 71,406 Maryl<strong>and</strong> ............... 210,087 62,343 22,873 23,895 15,575 113,376 66,578 30,478 ... 34,367 Massachusetts ........... 70,824 36,675 10,616 19,263 6,796 24,374 19,870 *4,504 ... 9,775 Michigan ............... 915,884 262,326 134,017 105,588 22,720 371,574 210,202 61,477 ... 281,985 Minnesota .............. 494,149 166,577 78,295 73,749 14,533 219,505 179,406 36,001 ... 108,066 Mississippi .............. 519,808 149,362 67,646 53,649 28,068 152,654 90,355 18,348 ... 217,792 Missouri ................ 1,146,240 234,468 90,216 108,385 35,866 499,132 283,748 57,023 ... 412,641 Montana ................ 310,540 132,808 48,044 50,289 34,475 144,951 62,657 16,417 *65,878 32,782 Nebraska................ 231,032 46,027 17,685 25,416 2,926 137,627 75,814 23,727 ... 47,378 Nevada ................. 129,080 39,574 18,022 16,193 5,360 76,412 17,082 12,631 ... 13,094 New Hampshire .......... 74,467 17,665 8,860 8,460 *344 48,294 37,199 2,776 ... 8,509 New Jersey .............. 146,001 72,680 34,083 19,133 *19,463 62,897 55,390 *6,862 ... 10,424 New Mexico............. 164,308 93,052 28,346 25,440 39,266 61,766 29,057 11,090 ... 9,490 NewYork............... 715,707 201,631 98,197 74,828 28,606 338,592 230,525 42,510 ... 175,485 North Carolina .......... 430,562 89,979 46,603 40,173 *3,203 314,578 202,839 17,825 ... 26,006 North Dakota ........... 129,114 72,445 28,270 31,908 *12,266 45,473 24,228 8,561 ... 11,196 Ohio ................... 841,556 148,609 73,341 66,995 *8,273 599,743 210,082 41,726 ... 93,204 Oklahoma .............. 476,657 135,335 52,990 69,314 13,031 307,048 111,501 22,468 *173,078 34,274 Oregon ................. 373,613 116,690 51,610 58,089 6,991 226,632 105,293 16,531 *104,808 30,290 Pennsylvania............. 1,609,045 274,158 125,470 123,397 25,290 1,037,875 390,810 96,587 ... 297,013 Rhode Isl<strong>and</strong> ............ 10,186 3,734 1,455 1,731 *547 5,839 5,113 *726 ... 613 South Carolina ........... 278,640 121,953 50,471 38,137 33,345 112,304 94,138 7,767 ... 44,382 South Dakota ............ 185,258 117,063 53,224 41,388 22,451 31,517 24,683 5,679 ... 36,678 Tennessee ............... 488,420 109,447 52,240 45,299 11,908 350,346 109,606 21,663 ... 28,627 Texas................... 2,222,298 873,928 337,965 335,890 200,073 785,297 445,492 125,975 ... 563,073 Utah ................... 273,782 71,575 25,915 37,255 8,405 180,329 92,425 30,042 *57,862 21,879 Vermont ................ 189,707 20,928 10,993 8,954 *981 151,053 17,658 2,587 ... 17,726 Virginia................. 480,802 124,862 60,585 56,592 7,686 297,143 167,914 25,158 ... 58,797 Washington.............. 313,134 74,233 33,083 36,528 4,622 188,739 66,625 44,120 ... 50,163 West Virginia ............ 284,511 79,376 40,194 38,070 *1,113 160,014 99,231 15,621 ... 45,121 Wisconsin ............... 1,312,128 275,268 147,349 104,350 23,569 316,756 170,466 53,572 ... 720,103 Wyoming ............... 137,265 62,991 31,901 22,090 9,000 45,632 22,802 9,655 ... 28,642 * Estimate based on a sample size <strong>of</strong> 10–29. ... Sample size too small to report data reliably. 1 Includes expenditures for magazine subscriptions, membership dues <strong>and</strong> contributions, l<strong>and</strong> leasing <strong>and</strong> ownership, <strong>and</strong> licenses, stamps, tags, <strong>and</strong> permits. Note: U.S. totals include responses from participants residing in the District <strong>of</strong> Columbia, as described in Appendix D. U.S. Fish & <strong>Wildlife</strong> Service <strong>2006</strong> <strong>National</strong> <strong>Survey</strong> <strong>of</strong> <strong>Fishing</strong>, <strong>Hunting</strong>, <strong>and</strong> <strong>Wildlife</strong>-<strong>Associated</strong> Recreation 107
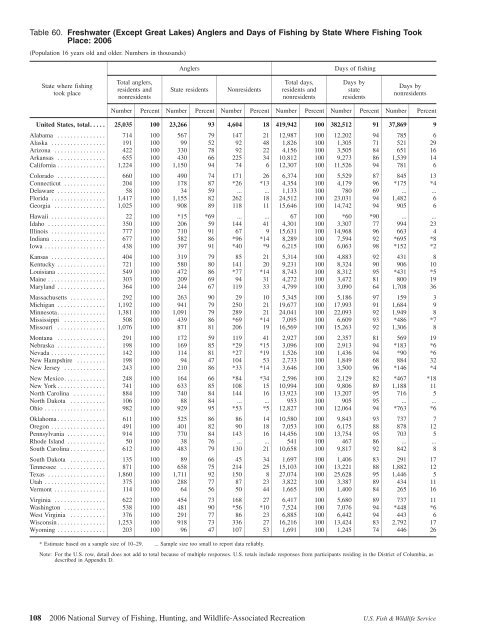
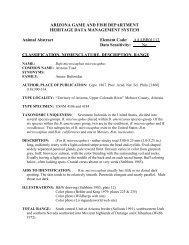
Table 60. Freshwater (Except Great Lakes) Anglers <strong>and</strong> Days <strong>of</strong> <strong>Fishing</strong> by State Where <strong>Fishing</strong> Took Place: <strong>2006</strong> (Population 16 years old <strong>and</strong> older. Numbers in thous<strong>and</strong>s) Anglers Days <strong>of</strong> fishing State where fishing took place Total anglers, residents <strong>and</strong> nonresidents State residents Nonresidents Total days, residents <strong>and</strong> nonresidents Days by state residents Days by nonresidents Number Percent Number Percent Number Percent Number Percent Number Percent Number Percent United States, total..... 25,035 100 23,266 93 4,604 18 419,942 100 382,512 91 37,869 9 Alabama ............... 714 100 567 79 147 21 12,987 100 12,202 94 785 6 Alaska ................. 191 100 99 52 92 48 1,826 100 1,305 71 521 29 Arizona ................ 422 100 330 78 92 22 4,156 100 3,505 84 651 16 Arkansas ............... 655 100 430 66 225 34 10,812 100 9,273 86 1,539 14 California ............... 1,224 100 1,150 94 74 6 12,307 100 11,526 94 781 6 Colorado ............... 660 100 490 74 171 26 6,374 100 5,529 87 845 13 Connecticut ............. 204 100 178 87 *26 *13 4,354 100 4,179 96 *175 *4 Delaware ............... 58 100 34 59 ... ... 1,133 100 780 69 ... ... Florida ................. 1,417 100 1,155 82 262 18 24,512 100 23,031 94 1,482 6 Georgia ................ 1,025 100 908 89 118 11 15,646 100 14,742 94 905 6 Hawaii ................. 22 100 *15 *69 ... ... 67 100 *60 *90 ... ... Idaho .................. 350 100 206 59 144 41 4,301 100 3,307 77 994 23 Illinois ................. 777 100 710 91 67 9 15,631 100 14,968 96 663 4 Indiana ................. 677 100 582 86 *96 *14 8,289 100 7,594 92 *695 *8 Iowa ................... 438 100 397 91 *40 *9 6,215 100 6,063 98 *152 *2 Kansas ................. 404 100 319 79 85 21 5,314 100 4,883 92 431 8 Kentucky ............... 721 100 580 80 141 20 9,231 100 8,324 90 906 10 Louisiana ............... 549 100 472 86 *77 *14 8,743 100 8,312 95 *431 *5 Maine .................. 303 100 209 69 94 31 4,272 100 3,472 81 800 19 Maryl<strong>and</strong> ............... 364 100 244 67 119 33 4,799 100 3,090 64 1,708 36 Massachusetts ........... 292 100 263 90 29 10 5,345 100 5,186 97 159 3 Michigan ............... 1,192 100 941 79 250 21 19,677 100 17,993 91 1,684 9 Minnesota ............... 1,381 100 1,091 79 289 21 24,041 100 22,093 92 1,949 8 Mississippi ............. 508 100 439 86 *69 *14 7,095 100 6,609 93 *486 *7 Missouri ............... 1,076 100 871 81 206 19 16,569 100 15,263 92 1,306 8 Montana ............... 291 100 172 59 119 41 2,927 100 2,357 81 569 19 Nebraska ............... 198 100 169 85 *29 *15 3,096 100 2,913 94 *183 *6 Nevada ................. 142 100 114 81 *27 *19 1,526 100 1,436 94 *90 *6 New Hampshire ......... 198 100 94 47 104 53 2,733 100 1,849 68 884 32 New Jersey ............. 243 100 210 86 *33 *14 3,646 100 3,500 96 *146 *4 New Mexico............. 248 100 164 66 *84 *34 2,596 100 2,129 82 *467 *18 NewYork............... 741 100 633 85 108 15 10,994 100 9,806 89 1,188 11 North Carolina .......... 884 100 740 84 144 16 13,923 100 13,207 95 716 5 North Dakota ........... 106 100 88 84 ... ... 953 100 905 95 ... ... Ohio ................... 982 100 929 95 *53 *5 12,827 100 12,064 94 *763 *6 Oklahoma ............... 611 100 525 86 86 14 10,580 100 9,843 93 737 7 Oregon ................. 491 100 401 82 90 18 7,053 100 6,175 88 878 12 Pennsylvania ............ 914 100 770 84 143 16 14,456 100 13,754 95 703 5 Rhode Isl<strong>and</strong> ............ 50 100 38 76 ... ... 541 100 467 86 ... ... South Carolina ........... 612 100 483 79 130 21 10,658 100 9,817 92 842 8 South Dakota ........... 135 100 89 66 45 34 1,697 100 1,406 83 291 17 Tennessee .............. 871 100 658 75 214 25 15,103 100 13,221 88 1,882 12 Texas .................. 1,860 100 1,711 92 150 8 27,074 100 25,628 95 1,446 5 Utah ................... 375 100 288 77 87 23 3,822 100 3,387 89 434 11 Vermont ................ 114 100 64 56 50 44 1,665 100 1,400 84 265 16 Virginia ................ 622 100 454 73 168 27 6,417 100 5,680 89 737 11 Washington ............. 538 100 481 90 *56 *10 7,524 100 7,076 94 *448 *6 West Virginia ........... 376 100 291 77 86 23 6,885 100 6,442 94 443 6 Wisconsin ............... 1,253 100 918 73 336 27 16,216 100 13,424 83 2,792 17 Wyoming ............... 203 100 96 47 107 53 1,691 100 1,245 74 446 26 * Estimate based on a sample size <strong>of</strong> 10–29. ... Sample size too small to report data reliably. Note: For the U.S. row, detail does not add to total because <strong>of</strong> multiple responses. U.S. totals include responses from participants residing in the District <strong>of</strong> Columbia, as described in Appendix D. 108 <strong>2006</strong> <strong>National</strong> <strong>Survey</strong> <strong>of</strong> <strong>Fishing</strong>, <strong>Hunting</strong>, <strong>and</strong> <strong>Wildlife</strong>-<strong>Associated</strong> Recreation U.S. Fish & <strong>Wildlife</strong> Service
- Page 1 and 2:
U.S. Fish & Wildlife Service 2006 N
- Page 3 and 4:
Economics and Statistics Administra
- Page 5 and 6:
List of Tables Fishing and Hunting:
- Page 7 and 8:
Foreword I find duck hunting with f
- Page 9 and 10:
Highlights
- Page 11 and 12:
wildlife watching. Secondary wildli
- Page 13 and 14:
Expenditures for Wildlife-Related R
- Page 15 and 16:
Fishing
- Page 17 and 18:
Fishing Expenditures Anglers spent
- Page 19 and 20:
special equipment such as boats, va
- Page 21 and 22:
anglers fishing for 20 million days
- Page 23 and 24:
Sex and Age of Anglers Although mor
- Page 25 and 26:
Education, Race, and Ethnicity Peop
- Page 27 and 28:
1996-2006 Fishing Participants, Day
- Page 29 and 30:
Hunting Highlights In 2006, 12.5 mi
- Page 31 and 32:
Big Game Hunting In 2006, a majorit
- Page 33 and 34:
Days per hunter Trips per hunter Co
- Page 35 and 36:
Hunting on Public and Private Lands
- Page 37 and 38:
Large MSA 28% Medium MSA 17% Percen
- Page 39 and 40:
1996-2006 Comparison of Hunting Act
- Page 41 and 42:
Wildlife Watching
- Page 43 and 44:
Wildlife-Watching Expenditures Thir
- Page 45 and 46:
Wildlife Fed, Observed, or Photogra
- Page 47 and 48:
Metropolitan and Nonmetropolitan Ar
- Page 49 and 50:
Education, Race, and Ethnicity of A
- Page 51 and 52:
Away-From-Home Participants by Type
- Page 53 and 54:
Away-From-Home Wildlife Watchers by
- Page 55 and 56:
Metropolitan and Nonmetropolitan Aw
- Page 57 and 58:
1996-2006 Comparison of Wildlife- W
- Page 59 and 60:
2001-2006 Wildlife-Watching Partici
- Page 61 and 62: Guide to Statistical Tables Purpose
- Page 63 and 64: Table 3. Freshwater Anglers and Day
- Page 65 and 66: Table 7. Hunters and Days of Huntin
- Page 67 and 68: Table 8. Selected Characteristics o
- Page 69 and 70: Table 9. Selected Characteristics o
- Page 71 and 72: Table 10. Selected Characteristics
- Page 73 and 74: Table 12. Expenditures for Fishing:
- Page 75 and 76: Table 14. Trip and Equipment Expend
- Page 77 and 78: Table 16. Trip and Equipment Expend
- Page 79 and 80: Table 18. Trip and Equipment Expend
- Page 81 and 82: Table 20. Trip and Equipment Expend
- Page 83 and 84: Table 22. Special Equipment Expendi
- Page 85 and 86: Table 25. Freshwater Anglers and Da
- Page 87 and 88: Table 29. Hunters and Days of Hunti
- Page 89 and 90: Table 32. Boats and Boat Launches U
- Page 91 and 92: Table 37. Hunters Using Bows and Ar
- Page 93 and 94: Table 41. Participation in Wildlife
- Page 95 and 96: Table 44. Expenditures for Wildlife
- Page 97 and 98: Table 45. Selected Characteristics
- Page 99 and 100: Table 46. Selected Characteristics
- Page 101 and 102: Table 50. Participation in Wildlife
- Page 103 and 104: Table 52. Expenditures for Wildlife
- Page 105 and 106: Table 53. Expenditures for Wildlife
- Page 107 and 108: Table 54. Anglers and Hunters by Sp
- Page 109 and 110: Table 56. Hunters by Type of Huntin
- Page 111: Table 58. Days of Hunting by Type o
- Page 115 and 116: Table 63. Days of Fishing by State
- Page 117 and 118: Table 65. Participation in Wildlife
- Page 119 and 120: Table 67. Participation in Away-Fro
- Page 121 and 122: Table 69. Expenditures for Wildlife
- Page 123 and 124: Appendix A. Defi nitions Annual hou
- Page 125 and 126: governments (such as State parks an
- Page 127 and 128: Appendix B. 2005 Participation of 6
- Page 129 and 130: Table B-3. Most Recent Year of Hunt
- Page 131 and 132: Table B-5. Anglers and Hunters 6 to
- Page 133 and 134: Table B-7. Selected Characteristics
- Page 135 and 136: Table B-9. Participants in Wildlife
- Page 137 and 138: Table B-11. Participants in Wildlif
- Page 139 and 140: Appendix C
- Page 141 and 142: Table C-1. Major Characteristics of
- Page 143 and 144: Table C-2. Anglers and Hunters by C
- Page 145 and 146: used most often, distance to boat l
- Page 147 and 148: Table C-4. Comparison of Major Find
- Page 149 and 150: Table C-5. Anglers and Hunters by C
- Page 151 and 152: Appendix D. Sample Design and Stati
- Page 153 and 154: 1. Base Weight. The base weight is
- Page 155 and 156: Standard Errors of Estimated Number
- Page 157 and 158: Table D-1. Approximate Standard Err
- Page 159 and 160: Table D-3. Approximate Standard Err
- Page 161 and 162: Table D-5. Approximate Standard Err
- Page 163 and 164:
Table D-7. Parameters a and b for C
- Page 165 and 166:
Table D-9. Parameters a, b, and c f
- Page 167 and 168:
Table D-11. Parameters a, b, and c