2006 National Survey of Fishing, Hunting, and Wildlife-Associated ...
2006 National Survey of Fishing, Hunting, and Wildlife-Associated ...
2006 National Survey of Fishing, Hunting, and Wildlife-Associated ...

Create successful ePaper yourself
Turn your PDF publications into a flip-book with our unique Google optimized e-Paper software.
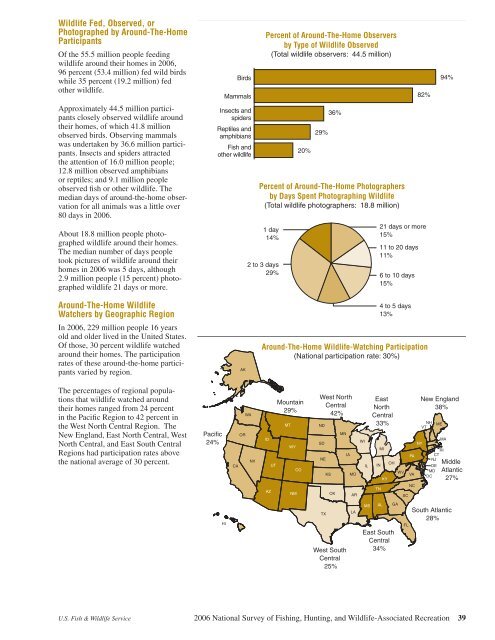
<strong>Wildlife</strong> Fed, Observed, or<br />
Photographed by Around-The-Home<br />
Participants<br />
Of the 55.5 million people feeding<br />
wildlife around their homes in <strong>2006</strong>,<br />
96 percent (53.4 million) fed wild birds<br />
while 35 percent (19.2 million) fed<br />
other wildlife.<br />
Approximately 44.5 million participants<br />
closely observed wildlife around<br />
their homes, <strong>of</strong> which 41.8 million<br />
observed birds. Observing mammals<br />
was undertaken by 36.6 million participants.<br />
Insects <strong>and</strong> spiders attracted<br />
the attention <strong>of</strong> 16.0 million people;<br />
12.8 million observed amphibians<br />
or reptiles; <strong>and</strong> 9.1 million people<br />
observed fish or other wildlife. The<br />
median days <strong>of</strong> around-the-home observation<br />
for all animals was a little over<br />
80 days in <strong>2006</strong>.<br />
About 18.8 million people photographed<br />
wildlife around their homes.<br />
The median number <strong>of</strong> days people<br />
took pictures <strong>of</strong> wildlife around their<br />
homes in <strong>2006</strong> was 5 days, although<br />
2.9 million people (15 percent) photographed<br />
wildlife 21 days or more.<br />
Insects <strong>and</strong><br />
spiders<br />
Reptiles <strong>and</strong><br />
amphibians<br />
Fish <strong>and</strong><br />
other wildlife<br />
Percent <strong>of</strong> Around-The-Home Observers<br />
by Type <strong>of</strong> <strong>Wildlife</strong> Observed<br />
(Total wildlife observers: 44.5 million)<br />
Birds 94%<br />
Mammals<br />
Percent <strong>of</strong> Around-The-Home Photographers<br />
by Days Spent Photographing <strong>Wildlife</strong><br />
(Total wildlife photographers: 18.8 million)<br />
1 day<br />
14%<br />
2 to 3 days<br />
29%<br />
20%<br />
29%<br />
36%<br />
21 days or more<br />
15%<br />
11 to 20 days<br />
11%<br />
6 to 10 days<br />
15%<br />
82%<br />
Around-The-Home <strong>Wildlife</strong><br />
Watchers by Geographic Region<br />
In <strong>2006</strong>, 229 million people 16 years<br />
old <strong>and</strong> older lived in the United States.<br />
Of those, 30 percent wildlife watched<br />
around their homes. The participation<br />
rates <strong>of</strong> these around-the-home participants<br />
varied by region.<br />
AK<br />
4 to 5 days<br />
13%<br />
Around-The-Home <strong>Wildlife</strong>-Watching Participation<br />
(<strong>National</strong> participation rate: 30%)<br />
The percentages <strong>of</strong> regional populations<br />
that wildlife watched around<br />
their homes ranged from 24 percent<br />
in the Pacific Region to 42 percent in<br />
the West North Central Region. The<br />
New Engl<strong>and</strong>, East North Central, West<br />
North Central, <strong>and</strong> East South Central<br />
Regions had participation rates above<br />
the national average <strong>of</strong> 30 percent.<br />
Pacific<br />
24%<br />
WA<br />
OR<br />
NV<br />
CA<br />
ID<br />
AZ<br />
UT<br />
Mountain<br />
29%<br />
MT<br />
WY<br />
NM<br />
CO<br />
West North<br />
Central<br />
42%<br />
ND<br />
SD<br />
NE<br />
KS<br />
OK<br />
MN<br />
IA<br />
MO<br />
AR<br />
WI<br />
IL<br />
East<br />
North<br />
Central<br />
33%<br />
IN<br />
MI<br />
KY<br />
TN<br />
OH<br />
WV<br />
SC<br />
PA<br />
VA<br />
NC<br />
NY<br />
New Engl<strong>and</strong><br />
38%<br />
NH<br />
VT<br />
ME<br />
MA<br />
RI<br />
CT<br />
NJ<br />
DE<br />
MD<br />
DC<br />
Middle<br />
Atlantic<br />
27%<br />
HI<br />
TX<br />
West South<br />
Central<br />
25%<br />
LA<br />
MS<br />
AL<br />
East South<br />
Central<br />
34%<br />
GA<br />
FL<br />
South Atlantic<br />
28%<br />
U.S. Fish & <strong>Wildlife</strong> Service <strong>2006</strong> <strong>National</strong> <strong>Survey</strong> <strong>of</strong> <strong>Fishing</strong>, <strong>Hunting</strong>, <strong>and</strong> <strong>Wildlife</strong>-<strong>Associated</strong> Recreation 39