2006 National Survey of Fishing, Hunting, and Wildlife-Associated ...
2006 National Survey of Fishing, Hunting, and Wildlife-Associated ...
2006 National Survey of Fishing, Hunting, and Wildlife-Associated ...

Create successful ePaper yourself
Turn your PDF publications into a flip-book with our unique Google optimized e-Paper software.
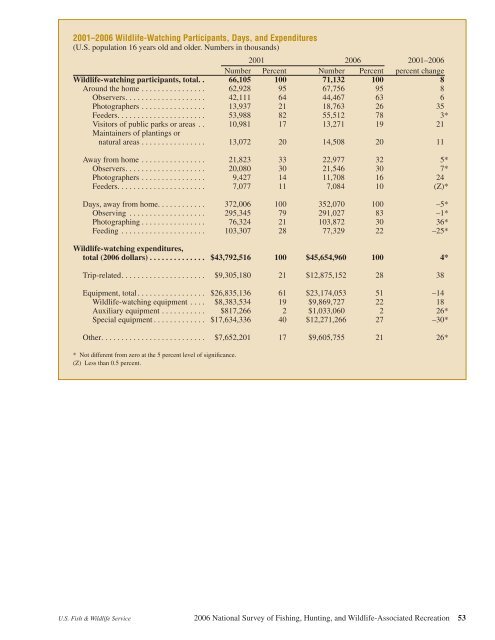
2001–<strong>2006</strong> <strong>Wildlife</strong>-Watching Participants, Days, <strong>and</strong> Expenditures<br />
(U.S. population 16 years old <strong>and</strong> older. Numbers in thous<strong>and</strong>s)<br />
2001 <strong>2006</strong> 2001–<strong>2006</strong><br />
Number Percent Number Percent percent change<br />
<strong>Wildlife</strong>-watching participants, total. . 66,105 100 71,132 100 8<br />
Around the home . . . . . . . . . . . . . . . . 62,928 95 67,756 95 8<br />
Observers . . . . . . . . . . . . . . . . . . . . 42,111 64 44,467 63 6<br />
Photographers . . . . . . . . . . . . . . . . 13,937 21 18,763 26 35<br />
Feeders. . . . . . . . . . . . . . . . . . . . . . 53,988 82 55,512 78 3 *<br />
Visitors <strong>of</strong> public parks or areas . . 10,981 17 13,271 19 21<br />
Maintainers <strong>of</strong> plantings or<br />
natural areas . . . . . . . . . . . . . . . . 13,072 20 14,508 20 11<br />
Away from home . . . . . . . . . . . . . . . . 21,823 33 22,977 32 5 *<br />
Observers . . . . . . . . . . . . . . . . . . . . 20,080 30 21,546 30 7 *<br />
Photographers . . . . . . . . . . . . . . . . 9,427 14 11,708 16 24<br />
Feeders. . . . . . . . . . . . . . . . . . . . . . 7,077 11 7,084 10 (Z)*<br />
Days, away from home. . . . . . . . . . . . 372,006 100 352,070 100 –5*<br />
Observing . . . . . . . . . . . . . . . . . . . 295,345 79 291,027 83 –1*<br />
Photographing . . . . . . . . . . . . . . . . 76,324 21 103,872 30 36 *<br />
Feeding . . . . . . . . . . . . . . . . . . . . . 103,307 28 77,329 22 –25*<br />
<strong>Wildlife</strong>-watching expenditures,<br />
total (<strong>2006</strong> dollars) . . . . . . . . . . . . . . $43,792,516 100 $45,654,960 100 4 *<br />
Trip-related . . . . . . . . . . . . . . . . . . . . . $9,305,180 21 $12,875,152 28 38<br />
Equipment, total . . . . . . . . . . . . . . . . . $26,835,136 61 $23,174,053 51 –14<br />
<strong>Wildlife</strong>-watching equipment . . . . $8,383,534 19 $9,869,727 22 18<br />
Auxiliary equipment . . . . . . . . . . . $817,266 2 $1,033,060 2 26 *<br />
Special equipment . . . . . . . . . . . . . $17,634,336 40 $12,271,266 27 –30*<br />
Other . . . . . . . . . . . . . . . . . . . . . . . . . . $7,652,201 17 $9,605,755 21 26 *<br />
* Not different from zero at the 5 percent level <strong>of</strong> significance.<br />
(Z) Less than 0.5 percent.<br />
U.S. Fish & <strong>Wildlife</strong> Service <strong>2006</strong> <strong>National</strong> <strong>Survey</strong> <strong>of</strong> <strong>Fishing</strong>, <strong>Hunting</strong>, <strong>and</strong> <strong>Wildlife</strong>-<strong>Associated</strong> Recreation 53