2006 National Survey of Fishing, Hunting, and Wildlife-Associated ...
2006 National Survey of Fishing, Hunting, and Wildlife-Associated ...
2006 National Survey of Fishing, Hunting, and Wildlife-Associated ...

Create successful ePaper yourself
Turn your PDF publications into a flip-book with our unique Google optimized e-Paper software.
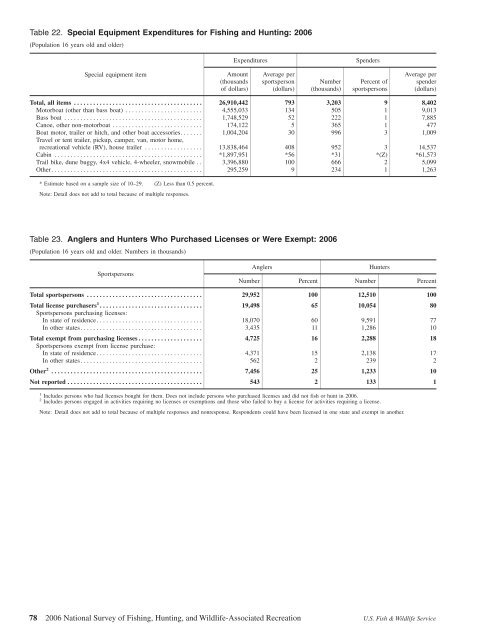
Table 22. Special Equipment Expenditures for <strong>Fishing</strong> <strong>and</strong> <strong>Hunting</strong>: <strong>2006</strong><br />
(Population 16 years old <strong>and</strong> older)<br />
Expenditures<br />
Spenders<br />
Special equipment item<br />
Amount<br />
(thous<strong>and</strong>s<br />
<strong>of</strong> dollars)<br />
Average per<br />
sportsperson<br />
(dollars)<br />
Number<br />
(thous<strong>and</strong>s)<br />
Percent <strong>of</strong><br />
sportspersons<br />
Average per<br />
spender<br />
(dollars)<br />
Total, all items ........................................ 26,910,442 793 3,203 9 8,402<br />
Motorboat (other than bass boat) ........................ 4,555,033 134 505 1 9,013<br />
Bass boat ........................................... 1,748,529 52 222 1 7,885<br />
Canoe, other non-motorboat ............................ 174,122 5 365 1 477<br />
Boat motor, trailer or hitch, <strong>and</strong> other boat accessories....... 1,004,204 30 996 3 1,009<br />
Travel or tent trailer, pickup, camper, van, motor home,<br />
recreational vehicle (RV), house trailer .................. 13,838,464 408 952 3 14,537<br />
Cabin .............................................. *1,897,951 *56 *31 *(Z) *61,573<br />
Trail bike, dune buggy, 4x4 vehicle, 4-wheeler, snowmobile . . 3,396,880 100 666 2 5,099<br />
Other............................................... 295,259 9 234 1 1,263<br />
* Estimate based on a sample size <strong>of</strong> 10–29. (Z) Less than 0.5 percent.<br />
Note: Detail does not add to total because <strong>of</strong> multiple responses.<br />
Table 23. Anglers <strong>and</strong> Hunters Who Purchased Licenses or Were Exempt: <strong>2006</strong><br />
(Population 16 years old <strong>and</strong> older. Numbers in thous<strong>and</strong>s)<br />
Sportspersons<br />
Anglers<br />
Hunters<br />
Number Percent Number Percent<br />
Total sportspersons .................................... 29,952 100 12,510 100<br />
Total license purchasers 1 ................................ 19,498 65 10,054 80<br />
Sportspersons purchasing licenses:<br />
In state <strong>of</strong> residence................................. 18,070 60 9,591 77<br />
In other states...................................... 3,435 11 1,286 10<br />
Total exempt from purchasing licenses .................... 4,725 16 2,288 18<br />
Sportspersons exempt from license purchase:<br />
In state <strong>of</strong> residence................................. 4,371 15 2,138 17<br />
In other states...................................... 562 2 239 2<br />
Other 2 ............................................... 7,456 25 1,233 10<br />
Not reported .......................................... 543 2 133 1<br />
1 Includes persons who had licenses bought for them. Does not include persons who purchased licenses <strong>and</strong> did not fish or hunt in <strong>2006</strong>.<br />
2 Includes persons engaged in activities requiring no licenses or exemptions <strong>and</strong> those who failed to buy a license for activities requiring a license.<br />
Note: Detail does not add to total because <strong>of</strong> multiple responses <strong>and</strong> nonresponse. Respondents could have been licensed in one state <strong>and</strong> exempt in another.<br />
78 <strong>2006</strong> <strong>National</strong> <strong>Survey</strong> <strong>of</strong> <strong>Fishing</strong>, <strong>Hunting</strong>, <strong>and</strong> <strong>Wildlife</strong>-<strong>Associated</strong> Recreation U.S. Fish & <strong>Wildlife</strong> Service