2006 National Survey of Fishing, Hunting, and Wildlife-Associated ...
2006 National Survey of Fishing, Hunting, and Wildlife-Associated ...
2006 National Survey of Fishing, Hunting, and Wildlife-Associated ...

Create successful ePaper yourself
Turn your PDF publications into a flip-book with our unique Google optimized e-Paper software.
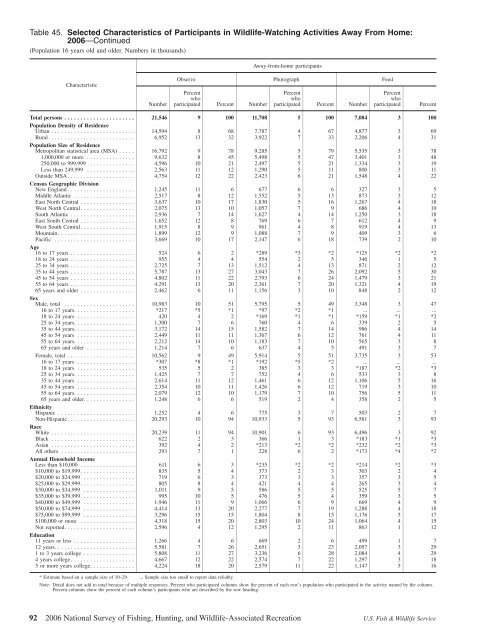
Table 45. Selected Characteristics <strong>of</strong> Participants in <strong>Wildlife</strong>-Watching Activities Away From Home:<br />
<strong>2006</strong>—Continued<br />
(Population 16 years old <strong>and</strong> older. Numbers in thous<strong>and</strong>s)<br />
Away-from-home participants<br />
Characteristic<br />
Number<br />
Observe Photograph Feed<br />
Percent<br />
who<br />
participated Percent Number<br />
Percent<br />
who<br />
participated Percent Number<br />
Percent<br />
who<br />
participated<br />
Percent<br />
Total persons ...................... 21,546 9 100 11,708 5 100 7,084 3 100<br />
Population Density <strong>of</strong> Residence<br />
Urban .......................... 14,594 8 68 7,787 4 67 4,877 3 69<br />
Rural. .......................... 6,952 13 32 3,922 7 33 2,206 4 31<br />
Population Size <strong>of</strong> Residence<br />
Metropolitan statistical area (MSA) ..... 16,792 9 78 9,285 5 79 5,535 3 78<br />
1,000,000 or more ............... 9,632 8 45 5,498 5 47 3,401 3 48<br />
250,000 to 999,999 .............. 4,596 10 21 2,497 5 21 1,334 3 19<br />
Less than 249,999 ............... 2,563 11 12 1,290 5 11 800 3 11<br />
Outside MSA ..................... 4,754 12 22 2,423 6 21 1,548 4 22<br />
Census Geographic Division<br />
New Engl<strong>and</strong> ..................... 1,245 11 6 677 6 6 327 3 5<br />
Middle Atlantic ................... 2,517 8 12 1,552 5 13 873 3 12<br />
East North Central ................. 3,637 10 17 1,830 5 16 1,267 4 18<br />
West North Central. ................ 2,075 13 10 1,057 7 9 686 4 10<br />
South Atlantic .................... 2,936 7 14 1,627 4 14 1,250 3 18<br />
East South Central ................. 1,652 12 8 769 6 7 612 4 9<br />
West South Central. ................ 1,915 8 9 961 4 8 919 4 13<br />
Mountain ........................ 1,899 12 9 1,088 7 9 409 3 6<br />
Pacific ......................... 3,669 10 17 2,147 6 18 739 2 10<br />
Age<br />
16 to 17 years .................... 524 6 2 *289 *3 *2 *125 *2 *2<br />
18 to 24 years .................... 955 4 4 554 2 5 346 1 5<br />
25 to 34 years .................... 2,725 7 13 1,512 4 13 871 2 12<br />
35 to 44 years .................... 5,787 13 27 3,043 7 26 2,092 5 30<br />
45 to 54 years .................... 4,802 11 22 2,793 6 24 1,479 3 21<br />
55 to 64 years .................... 4,291 13 20 2,361 7 20 1,321 4 19<br />
65 years <strong>and</strong> older ................. 2,462 6 11 1,156 3 10 848 2 12<br />
Sex<br />
Male, total ...................... 10,983 10 51 5,795 5 49 3,348 3 47<br />
16 to 17 years. .................. *217 *5 *1 *97 *2 *1 ... ... ...<br />
18 to 24 years .................. 420 4 2 *169 *1 *1 *159 *1 *2<br />
25 to 34 years. .................. 1,300 7 6 760 4 6 339 2 5<br />
35 to 44 years. .................. 3,172 14 15 1,582 7 14 986 4 14<br />
45 to 54 years .................. 2,449 11 11 1,367 6 12 761 4 11<br />
55 to 64 years. .................. 2,212 14 10 1,183 7 10 565 3 8<br />
65 years <strong>and</strong> older ............... 1,214 7 6 637 4 5 491 3 7<br />
Female, total ..................... 10,562 9 49 5,914 5 51 3,735 3 53<br />
16 to 17 years .................. *307 *8 *1 *192 *5 *2 ... ... ...<br />
18 to 24 years .................. 535 5 2 385 3 3 *187 *2 *3<br />
25 to 34 years. .................. 1,425 7 7 752 4 6 533 3 8<br />
35 to 44 years .................. 2,614 11 12 1,461 6 12 1,106 5 16<br />
45 to 54 years .................. 2,354 10 11 1,426 6 12 719 3 10<br />
55 to 64 years. .................. 2,079 12 10 1,179 7 10 756 5 11<br />
65 years <strong>and</strong> older. ............... 1,248 6 6 519 2 4 358 2 5<br />
Ethnicity<br />
Hispanic ........................ 1,252 4 6 775 3 7 503 2 7<br />
Non-Hispanic ..................... 20,293 10 94 10,933 5 93 6,581 3 93<br />
Race<br />
White .......................... 20,239 11 94 10,901 6 93 6,496 3 92<br />
Black .......................... 622 2 3 366 1 3 *183 *1 *3<br />
Asian .......................... 392 4 2 *213 *2 *2 *232 *2 *3<br />
All others ....................... 293 7 1 228 6 2 *173 *4 *2<br />
Annual Household Income<br />
Less than $10,000 ................. 611 6 3 *235 *2 *2 *214 *2 *3<br />
$10,000 to $19,999. ................ 835 5 4 373 2 3 303 2 4<br />
$20,000 to $24,999 ................ 719 6 3 373 3 3 357 3 5<br />
$25,000 to $29,999. ................ 805 8 4 421 4 4 265 3 4<br />
$30,000 to $34,999 ................ 1,011 9 5 586 5 5 525 5 7<br />
$35,000 to $39,999. ................ 995 10 5 476 5 4 359 3 5<br />
$40,000 to $49,999 ................ 1,946 11 9 1,066 6 9 669 4 9<br />
$50,000 to $74,999 ................ 4,414 13 20 2,277 7 19 1,288 4 18<br />
$75,000 to $99,999 ................ 3,296 15 15 1,804 8 15 1,176 5 17<br />
$100,000 or more ................. 4,318 15 20 2,803 10 24 1,064 4 15<br />
Not reported. ..................... 2,596 4 12 1,295 2 11 863 1 12<br />
Education<br />
11 years or less ................... 1,266 4 6 669 2 6 499 1 7<br />
12 years. ........................ 5,581 7 26 2,651 3 23 2,057 3 29<br />
1 to 3 years college ................ 5,808 11 27 3,236 6 28 2,084 4 29<br />
4 years college .................... 4,667 12 22 2,574 7 22 1,297 3 18<br />
5 or more years college. ............. 4,224 18 20 2,579 11 22 1,147 5 16<br />
* Estimate based on a sample size <strong>of</strong> 10–29. ... Sample size too small to report data reliably.<br />
Note: Detail does not add to total because <strong>of</strong> multiple responses. Percent who participated columns show the percent <strong>of</strong> each row’s population who participated in the activity named by the column.<br />
Percent columns show the percent <strong>of</strong> each column’s participants who are described by the row heading.<br />
92 <strong>2006</strong> <strong>National</strong> <strong>Survey</strong> <strong>of</strong> <strong>Fishing</strong>, <strong>Hunting</strong>, <strong>and</strong> <strong>Wildlife</strong>-<strong>Associated</strong> Recreation U.S. Fish & <strong>Wildlife</strong> Service