2006 National Survey of Fishing, Hunting, and Wildlife-Associated ...
2006 National Survey of Fishing, Hunting, and Wildlife-Associated ...
2006 National Survey of Fishing, Hunting, and Wildlife-Associated ...

You also want an ePaper? Increase the reach of your titles
YUMPU automatically turns print PDFs into web optimized ePapers that Google loves.
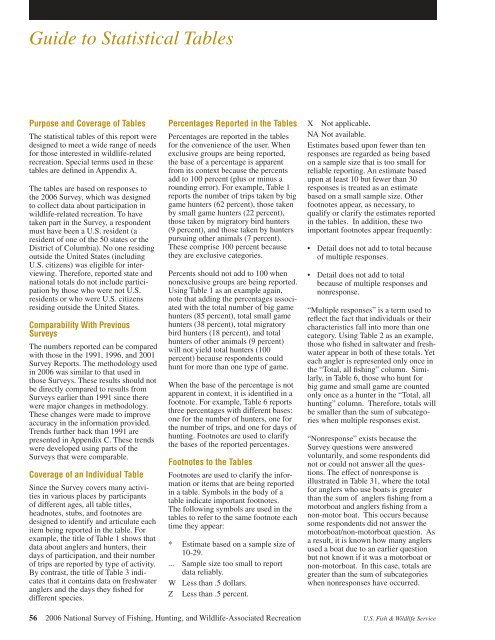
Guide to Statistical Tables<br />
Purpose <strong>and</strong> Coverage <strong>of</strong> Tables<br />
The statistical tables <strong>of</strong> this report were<br />
designed to meet a wide range <strong>of</strong> needs<br />
for those interested in wildlife-related<br />
recreation. Special terms used in these<br />
tables are defined in Appendix A.<br />
The tables are based on responses to<br />
the <strong>2006</strong> <strong>Survey</strong>, which was designed<br />
to collect data about participation in<br />
wi ldlife-related recreation. To have<br />
taken part in the <strong>Survey</strong>, a respondent<br />
must have been a U.S. resident (a<br />
resident <strong>of</strong> one <strong>of</strong> the 50 states or the<br />
District <strong>of</strong> Columbia). No one residing<br />
outside the United States (including<br />
U.S. citizens) was eligible for interviewing.<br />
Therefore, reported state <strong>and</strong><br />
national totals do not include participation<br />
by those who were not U.S.<br />
residents or who were U.S. citizens<br />
residing outside the United States.<br />
Comparability With Previous<br />
<strong>Survey</strong>s<br />
The numbers reported can be compared<br />
with those in the 1991, 1996, <strong>and</strong> 2001<br />
<strong>Survey</strong> Reports. The methodology used<br />
in <strong>2006</strong> was similar to that used in<br />
those <strong>Survey</strong>s. These results should not<br />
be directly compared to results from<br />
<strong>Survey</strong>s earlier than 1991 since there<br />
were major changes in methodology.<br />
These changes were made to improve<br />
accuracy in the information provided.<br />
Trends further back than 1991 are<br />
presented in Appendix C. These trends<br />
were developed using parts <strong>of</strong> the<br />
<strong>Survey</strong>s that were comparable.<br />
Coverage <strong>of</strong> an Individual Table<br />
Since the <strong>Survey</strong> covers many activities<br />
in various places by participants<br />
<strong>of</strong> different ages, all table titles,<br />
headnotes, stubs, <strong>and</strong> footnotes are<br />
designed to identify <strong>and</strong> articulate each<br />
item being reported in the table. For<br />
example, the title <strong>of</strong> Table 1 shows that<br />
data about anglers <strong>and</strong> hunters, their<br />
days <strong>of</strong> participation, <strong>and</strong> their number<br />
<strong>of</strong> trips are reported by type <strong>of</strong> activity.<br />
By contrast, the title <strong>of</strong> Table 3 indicates<br />
that it contains data on freshwater<br />
anglers <strong>and</strong> the days they fished for<br />
different species.<br />
Percentages Reported in the Tables<br />
Percentages are reported in the tables<br />
for the convenience <strong>of</strong> the user. When<br />
exclusive groups are being reported,<br />
the base <strong>of</strong> a percentage is apparent<br />
from its context because the percents<br />
add to 100 percent (plus or minus a<br />
rounding error). For example, Table 1<br />
reports the number <strong>of</strong> trips taken by big<br />
game hunters (62 percent), those taken<br />
by small game hunters (22 percent),<br />
those taken by migratory bird hunters<br />
(9 percent), <strong>and</strong> those taken by hunters<br />
pursuing other animals (7 percent).<br />
These comprise 100 percent because<br />
they are exclusive categories.<br />
Percents should not add to 100 when<br />
nonexclusive groups are being reported.<br />
Using Table 1 as an example again,<br />
note that adding the percentages associated<br />
with the total number <strong>of</strong> big game<br />
hunters (85 percent), total small game<br />
hunters (38 percent), total migratory<br />
bird hunters (18 percent), <strong>and</strong> total<br />
hunters <strong>of</strong> other animals (9 percent)<br />
will not yield total hunters (100<br />
percent) because respondents could<br />
hunt for more than one type <strong>of</strong> game.<br />
When the base <strong>of</strong> the percentage is not<br />
apparent in context, it is identified in a<br />
footnote. For example, Table 6 reports<br />
three percentages with different bases:<br />
one for the number <strong>of</strong> hunters, one for<br />
the number <strong>of</strong> trips, <strong>and</strong> one for days <strong>of</strong><br />
hunting. Footnotes are used to clarify<br />
the bases <strong>of</strong> the reported percentages.<br />
Footnotes to the Tables<br />
Footnotes are used to clarify the information<br />
or items that are being reported<br />
in a table. Symbols in the body <strong>of</strong> a<br />
table indicate important footnotes.<br />
The following symbols are used in the<br />
tables to refer to the same footnote each<br />
time they appear:<br />
* Estimate based on a sample size <strong>of</strong><br />
10-29.<br />
... Sample size too small to report<br />
data reliably.<br />
W Less than .5 dollars.<br />
Z Less than .5 percent.<br />
X Not applicable.<br />
NA Not available.<br />
Estimates based upon fewer than ten<br />
responses are regarded as being based<br />
on a sample size that is too small for<br />
reliable reporting. An estimate based<br />
upon at least 10 but fewer than 30<br />
responses is treated as an estimate<br />
based on a small sample size. Other<br />
footnotes appear, as necessary, to<br />
qualify or clarify the estimates reported<br />
in the tables. In addition, these two<br />
important footnotes appear frequently:<br />
• Detail does not add to total because<br />
<strong>of</strong> multiple responses.<br />
• Detail does not add to total<br />
because <strong>of</strong> multiple responses <strong>and</strong><br />
no nresponse.<br />
“Multiple responses” is a term used to<br />
reflect the fact that individuals or their<br />
characteristics fall into more than one<br />
category. Using Table 2 as an example,<br />
those who fished in saltwater <strong>and</strong> freshwater<br />
appear in both <strong>of</strong> these totals. Yet<br />
each angler is represented only once in<br />
the “Total, all fishing” column. Similarly,<br />
in Table 6, those who hunt for<br />
big game <strong>and</strong> small game are counted<br />
only once as a hunter in the “Total, all<br />
hunting” column. Therefore, totals will<br />
be smaller than the sum <strong>of</strong> subcategories<br />
when multiple responses exist.<br />
“Nonresponse” exists because the<br />
<strong>Survey</strong> questions were answered<br />
voluntarily, <strong>and</strong> some respondents did<br />
not or could not answer all the questions.<br />
The effect <strong>of</strong> nonresponse is<br />
illustrated in Table 31, where the total<br />
for anglers who use boats is greater<br />
than the sum <strong>of</strong> anglers fishing from a<br />
motorboat <strong>and</strong> anglers fishing from a<br />
non-motor boat. This occurs because<br />
some respondents did not answer the<br />
motorboat/non-motorboat question. As<br />
a result, it is known how many anglers<br />
used a boat due to an earlier question<br />
but not known if it was a motorboat or<br />
non-motorboat. In this case, totals are<br />
greater than the sum <strong>of</strong> subcategories<br />
when nonresponses have occurred.<br />
56 <strong>2006</strong> <strong>National</strong> <strong>Survey</strong> <strong>of</strong> <strong>Fishing</strong>, <strong>Hunting</strong>, <strong>and</strong> <strong>Wildlife</strong>-<strong>Associated</strong> Recreation U.S. Fish & <strong>Wildlife</strong> Service