2006 National Survey of Fishing, Hunting, and Wildlife-Associated ...
2006 National Survey of Fishing, Hunting, and Wildlife-Associated ...
2006 National Survey of Fishing, Hunting, and Wildlife-Associated ...

You also want an ePaper? Increase the reach of your titles
YUMPU automatically turns print PDFs into web optimized ePapers that Google loves.
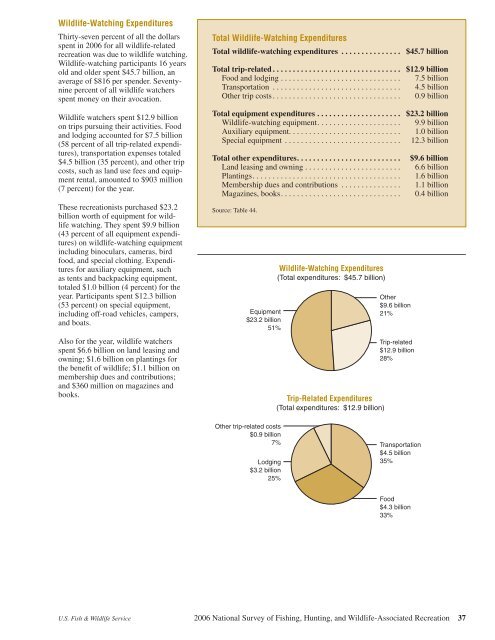
<strong>Wildlife</strong>-Watching Expenditures<br />
Thirty-seven percent <strong>of</strong> all the dollars<br />
spent in <strong>2006</strong> for all wildlife-related<br />
recreation was due to wildlife watching.<br />
<strong>Wildlife</strong>-watching participants 16 years<br />
old <strong>and</strong> older spent $45.7 billion, an<br />
average <strong>of</strong> $816 per spender. Seventynine<br />
percent <strong>of</strong> all wildlife watchers<br />
spent money on their avocation.<br />
<strong>Wildlife</strong> watchers spent $12.9 billion<br />
on trips pursuing their activities. Food<br />
<strong>and</strong> lodging accounted for $7.5 billion<br />
(58 percent <strong>of</strong> all trip-related expenditures),<br />
transportation expenses totaled<br />
$4.5 billion (35 percent), <strong>and</strong> other trip<br />
costs, such as l<strong>and</strong> use fees <strong>and</strong> equipment<br />
rental, amounted to $903 million<br />
(7 percent) for the year.<br />
These recreationists purchased $23.2<br />
billion worth <strong>of</strong> equipment for wildlife<br />
watching. They spent $9.9 billion<br />
(43 percent <strong>of</strong> all equipment expenditures)<br />
on wildlife-watching equipment<br />
including binoculars, cameras, bird<br />
food, <strong>and</strong> special clothing. Expenditures<br />
for auxiliary equipment, such<br />
as tents <strong>and</strong> backpacking equipment,<br />
totaled $1.0 billion (4 percent) for the<br />
year. Participants spent $12.3 billion<br />
(53 percent) on special equipment,<br />
including <strong>of</strong>f-road vehicles, campers,<br />
<strong>and</strong> boats.<br />
Also for the year, wildlife watchers<br />
spent $6.6 billion on l<strong>and</strong> leasing <strong>and</strong><br />
owning; $1.6 billion on plantings for<br />
the benefit <strong>of</strong> wildlife; $1.1 billion on<br />
membership dues <strong>and</strong> contributions;<br />
<strong>and</strong> $360 million on magazines <strong>and</strong><br />
books.<br />
Total <strong>Wildlife</strong>-Watching Expenditures<br />
Total wildlife-watching expenditures . . . . . . . . . . . . . . . $45.7 billion<br />
Total trip-related . . . . . . . . . . . . . . . . . . . . . . . . . . . . . . . . $12.9 billion<br />
Food <strong>and</strong> lodging . . . . . . . . . . . . . . . . . . . . . . . . . . . . . . 7.5 billion<br />
Transportation . . . . . . . . . . . . . . . . . . . . . . . . . . . . . . . . 4.5 billion<br />
Other trip costs . . . . . . . . . . . . . . . . . . . . . . . . . . . . . . . . 0.9 billion<br />
Total equipment expenditures . . . . . . . . . . . . . . . . . . . . . $23.2 billion<br />
<strong>Wildlife</strong>-watching equipment . . . . . . . . . . . . . . . . . . . . . 9.9 billion<br />
Auxiliary equipment. . . . . . . . . . . . . . . . . . . . . . . . . . . . 1.0 billion<br />
Special equipment . . . . . . . . . . . . . . . . . . . . . . . . . . . . . 12.3 billion<br />
Total other expenditures . . . . . . . . . . . . . . . . . . . . . . . . . .<br />
L<strong>and</strong> leasing <strong>and</strong> owning . . . . . . . . . . . . . . . . . . . . . . . .<br />
Plantings . . . . . . . . . . . . . . . . . . . . . . . . . . . . . . . . . . . . .<br />
Membership dues <strong>and</strong> contributions . . . . . . . . . . . . . . .<br />
Magazines, books . . . . . . . . . . . . . . . . . . . . . . . . . . . . . .<br />
Source: Table 44.<br />
Equipment<br />
$23.2 billion<br />
51%<br />
<strong>Wildlife</strong>-Watching Expenditures<br />
(Total expenditures: $45.7 billion)<br />
Trip-Related Expenditures<br />
(Total expenditures: $12.9 billion)<br />
Other<br />
$9.6 billion<br />
21%<br />
Trip-related<br />
$12.9 billion<br />
28%<br />
$9.6 billion<br />
6.6 billion<br />
1.6 billion<br />
1.1 billion<br />
0.4 billion<br />
Other trip-related costs<br />
$0.9 billion<br />
7%<br />
Lodging<br />
$3.2 billion<br />
25%<br />
Transportation<br />
$4.5 billion<br />
35%<br />
Food<br />
$4.3 billion<br />
33%<br />
U.S. Fish & <strong>Wildlife</strong> Service <strong>2006</strong> <strong>National</strong> <strong>Survey</strong> <strong>of</strong> <strong>Fishing</strong>, <strong>Hunting</strong>, <strong>and</strong> <strong>Wildlife</strong>-<strong>Associated</strong> Recreation 37