2006 National Survey of Fishing, Hunting, and Wildlife-Associated ...
2006 National Survey of Fishing, Hunting, and Wildlife-Associated ...
2006 National Survey of Fishing, Hunting, and Wildlife-Associated ...

You also want an ePaper? Increase the reach of your titles
YUMPU automatically turns print PDFs into web optimized ePapers that Google loves.
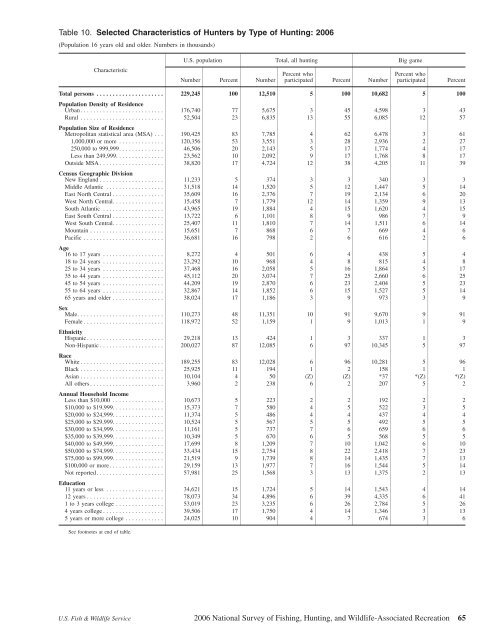
Table 10. Selected Characteristics <strong>of</strong> Hunters by Type <strong>of</strong> <strong>Hunting</strong>: <strong>2006</strong><br />
(Population 16 years old <strong>and</strong> older. Numbers in thous<strong>and</strong>s)<br />
Characteristic<br />
U.S. population Total, all hunting Big game<br />
Number Percent Number<br />
Percent who<br />
participated Percent Number<br />
Percent who<br />
participated<br />
Percent<br />
Total persons ..................... 229,245 100 12,510 5 100 10,682 5 100<br />
Population Density <strong>of</strong> Residence<br />
Urban. ......................... 176,740 77 5,675 3 45 4,598 3 43<br />
Rural .......................... 52,504 23 6,835 13 55 6,085 12 57<br />
Population Size <strong>of</strong> Residence<br />
Metropolitan statistical area (MSA) . . . 190,425 83 7,785 4 62 6,478 3 61<br />
1,000,000 or more .............. 120,356 53 3,551 3 28 2,936 2 27<br />
250,000 to 999,999. ............. 46,506 20 2,143 5 17 1,774 4 17<br />
Less than 249,999. .............. 23,562 10 2,092 9 17 1,768 8 17<br />
Outside MSA .................... 38,820 17 4,724 12 38 4,205 11 39<br />
Census Geographic Division<br />
New Engl<strong>and</strong> .................... 11,233 5 374 3 3 340 3 3<br />
Middle Atlantic .................. 31,518 14 1,520 5 12 1,447 5 14<br />
East North Central ................ 35,609 16 2,376 7 19 2,134 6 20<br />
West North Central. ............... 15,458 7 1,779 12 14 1,359 9 13<br />
South Atlantic ................... 43,965 19 1,884 4 15 1,620 4 15<br />
East South Central ................ 13,722 6 1,101 8 9 986 7 9<br />
West South Central. ............... 25,407 11 1,810 7 14 1,511 6 14<br />
Mountain ....................... 15,651 7 868 6 7 669 4 6<br />
Pacific ......................... 36,681 16 798 2 6 616 2 6<br />
Age<br />
16to17years ................... 8,272 4 501 6 4 438 5 4<br />
18to24years ................... 23,292 10 968 4 8 815 4 8<br />
25to34years ................... 37,468 16 2,058 5 16 1,864 5 17<br />
35 to 44 years ................... 45,112 20 3,074 7 25 2,660 6 25<br />
45to54years ................... 44,209 19 2,870 6 23 2,404 5 23<br />
55 to 64 years ................... 32,867 14 1,852 6 15 1,527 5 14<br />
65 years <strong>and</strong> older ................ 38,024 17 1,186 3 9 973 3 9<br />
Sex<br />
Male. .......................... 110,273 48 11,351 10 91 9,670 9 91<br />
Female ......................... 118,972 52 1,159 1 9 1,013 1 9<br />
Ethnicity<br />
Hispanic ........................ 29,218 13 424 1 3 337 1 3<br />
Non-Hispanic .................... 200,027 87 12,085 6 97 10,345 5 97<br />
Race<br />
White .......................... 189,255 83 12,028 6 96 10,281 5 96<br />
Black .......................... 25,925 11 194 1 2 158 1 1<br />
Asian .......................... 10,104 4 50 (Z) (Z) *37 *(Z) *(Z)<br />
All others ....................... 3,960 2 238 6 2 207 5 2<br />
Annual Household Income<br />
Less than $10,000 ................ 10,673 5 223 2 2 192 2 2<br />
$10,000 to $19,999. ............... 15,373 7 580 4 5 522 3 5<br />
$20,000 to $24,999. ............... 11,374 5 486 4 4 437 4 4<br />
$25,000 to $29,999. ............... 10,524 5 567 5 5 492 5 5<br />
$30,000 to $34,999. ............... 11,161 5 737 7 6 659 6 6<br />
$35,000 to $39,999. ............... 10,349 5 670 6 5 568 5 5<br />
$40,000 to $49,999. ............... 17,699 8 1,209 7 10 1,042 6 10<br />
$50,000 to $74,999. ............... 33,434 15 2,754 8 22 2,418 7 23<br />
$75,000 to $99,999. ............... 21,519 9 1,739 8 14 1,435 7 13<br />
$100,000 or more. ................ 29,159 13 1,977 7 16 1,544 5 14<br />
Not reported. .................... 57,981 25 1,568 3 13 1,375 2 13<br />
Education<br />
11 years or less .................. 34,621 15 1,724 5 14 1,543 4 14<br />
12 years ........................ 78,073 34 4,896 6 39 4,335 6 41<br />
1 to 3 years college ............... 53,019 23 3,235 6 26 2,784 5 26<br />
4 years college ................... 39,506 17 1,750 4 14 1,346 3 13<br />
5 years or more college ............ 24,025 10 904 4 7 674 3 6<br />
See footnotes at end <strong>of</strong> table.<br />
U.S. Fish & <strong>Wildlife</strong> Service <strong>2006</strong> <strong>National</strong> <strong>Survey</strong> <strong>of</strong> <strong>Fishing</strong>, <strong>Hunting</strong>, <strong>and</strong> <strong>Wildlife</strong>-<strong>Associated</strong> Recreation 65