2006 National Survey of Fishing, Hunting, and Wildlife-Associated ...
2006 National Survey of Fishing, Hunting, and Wildlife-Associated ...
2006 National Survey of Fishing, Hunting, and Wildlife-Associated ...

Create successful ePaper yourself
Turn your PDF publications into a flip-book with our unique Google optimized e-Paper software.
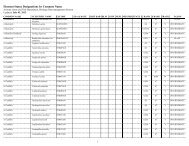
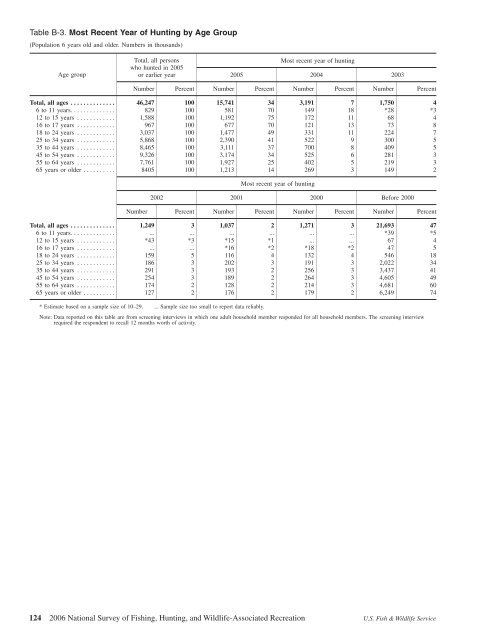
Table B-3. Most Recent Year <strong>of</strong> <strong>Hunting</strong> by Age Group<br />
(Population 6 years old <strong>and</strong> older. Numbers in thous<strong>and</strong>s)<br />
Age group<br />
Total, all persons<br />
who hunted in 2005<br />
or earlier year<br />
Most recent year <strong>of</strong> hunting<br />
2005 2004 2003<br />
Number Percent Number Percent Number Percent Number Percent<br />
Total, all ages .............. 46,247 100 15,741 34 3,191 7 1,750 4<br />
6 to 11 years.............. 829 100 581 70 149 18 *28 *3<br />
12 to 15 years ............ 1,588 100 1,192 75 172 11 68 4<br />
16 to 17 years ............ 967 100 677 70 121 13 73 8<br />
18 to 24 years ............ 3,037 100 1,477 49 331 11 224 7<br />
25 to 34 years ............ 5,868 100 2,390 41 522 9 300 5<br />
35 to 44 years ............ 8,465 100 3,111 37 700 8 409 5<br />
45 to 54 years ............ 9,326 100 3,174 34 525 6 281 3<br />
55 to 64 years ............ 7,761 100 1,927 25 402 5 219 3<br />
65 years or older .......... 8405 100 1,213 14 269 3 149 2<br />
Most recent year <strong>of</strong> hunting<br />
2002 2001 2000 Before 2000<br />
Number Percent Number Percent Number Percent Number Percent<br />
Total, all ages .............. 1,249 3 1,037 2 1,271 3 21,693 47<br />
6 to 11 years.............. ... ... ... ... ... ... *39 *5<br />
12 to 15 years ............ *43 *3 *15 *1 ... ... 67 4<br />
16 to 17 years ............ ... ... *16 *2 *18 *2 47 5<br />
18 to 24 years ............ 159 5 116 4 132 4 546 18<br />
25 to 34 years ............ 186 3 202 3 191 3 2,022 34<br />
35 to 44 years ............ 291 3 193 2 256 3 3,437 41<br />
45 to 54 years ............ 254 3 189 2 264 3 4,605 49<br />
55 to 64 years ............ 174 2 128 2 214 3 4,681 60<br />
65 years or older .......... 127 2 176 2 179 2 6,249 74<br />
* Estimate based on a sample size <strong>of</strong> 10–29. ... Sample size too small to report data reliably.<br />
Note: Data reported on this table are from screening interviews in which one adult household member responded for all household members. The screening interview<br />
required the respondent to recall 12 months worth <strong>of</strong> activity.<br />
124 <strong>2006</strong> <strong>National</strong> <strong>Survey</strong> <strong>of</strong> <strong>Fishing</strong>, <strong>Hunting</strong>, <strong>and</strong> <strong>Wildlife</strong>-<strong>Associated</strong> Recreation U.S. Fish & <strong>Wildlife</strong> Service