2006 National Survey of Fishing, Hunting, and Wildlife-Associated ...
2006 National Survey of Fishing, Hunting, and Wildlife-Associated ...
2006 National Survey of Fishing, Hunting, and Wildlife-Associated ...

You also want an ePaper? Increase the reach of your titles
YUMPU automatically turns print PDFs into web optimized ePapers that Google loves.
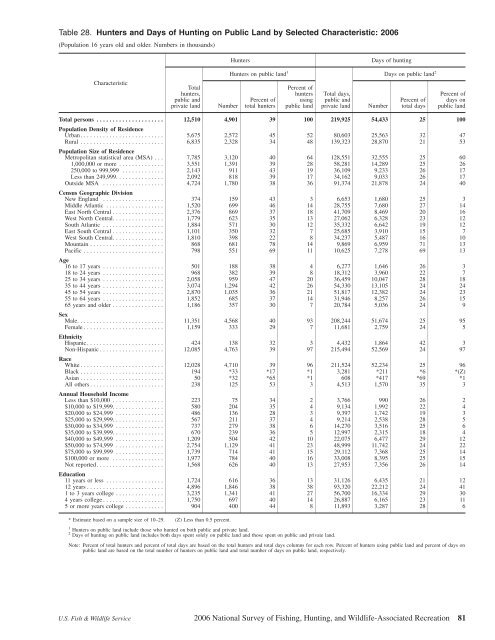
Table 28. Hunters <strong>and</strong> Days <strong>of</strong> <strong>Hunting</strong> on Public L<strong>and</strong> by Selected Characteristic: <strong>2006</strong><br />
(Population 16 years old <strong>and</strong> older. Numbers in thous<strong>and</strong>s)<br />
Hunters<br />
Days <strong>of</strong> hunting<br />
Characteristic<br />
Total<br />
hunters,<br />
public <strong>and</strong><br />
private l<strong>and</strong><br />
Number<br />
Hunters on public l<strong>and</strong> 1<br />
Percent <strong>of</strong><br />
total hunters<br />
Percent <strong>of</strong><br />
hunters<br />
using<br />
public l<strong>and</strong><br />
Total days,<br />
public <strong>and</strong><br />
private l<strong>and</strong><br />
Number<br />
Days on public l<strong>and</strong> 2<br />
Percent <strong>of</strong><br />
total days<br />
Percent <strong>of</strong><br />
days on<br />
public l<strong>and</strong><br />
Total persons ..................... 12,510 4,901 39 100 219,925 54,433 25 100<br />
Population Density <strong>of</strong> Residence<br />
Urban. ......................... 5,675 2,572 45 52 80,603 25,563 32 47<br />
Rural .......................... 6,835 2,328 34 48 139,323 28,870 21 53<br />
Population Size <strong>of</strong> Residence<br />
Metropolitan statistical area (MSA) . . . 7,785 3,120 40 64 128,551 32,555 25 60<br />
1,000,000 or more .............. 3,551 1,391 39 28 58,281 14,289 25 26<br />
250,000 to 999,999 ............. 2,143 911 43 19 36,109 9,233 26 17<br />
Less than 249,999. .............. 2,092 818 39 17 34,162 9,033 26 17<br />
Outside MSA ................... 4,724 1,780 38 36 91,374 21,878 24 40<br />
Census Geographic Division<br />
New Engl<strong>and</strong> ................... 374 159 43 3 6,653 1,680 25 3<br />
Middle Atlantic .................. 1,520 699 46 14 28,755 7,680 27 14<br />
East North Central ................ 2,376 869 37 18 41,709 8,469 20 16<br />
West North Central. ............... 1,779 623 35 13 27,062 6,328 23 12<br />
South Atlantic ................... 1,884 571 30 12 35,332 6,642 19 12<br />
East South Central ................ 1,101 350 32 7 25,685 3,910 15 7<br />
West South Central. ............... 1,810 398 22 8 34,237 5,487 16 10<br />
Mountain ....................... 868 681 78 14 9,869 6,959 71 13<br />
Pacific ......................... 798 551 69 11 10,625 7,278 69 13<br />
Age<br />
16 to 17 years ................... 501 188 38 4 6,277 1,646 26 3<br />
18 to 24 years ................... 968 382 39 8 18,312 3,960 22 7<br />
25 to 34 years ................... 2,058 959 47 20 36,459 10,047 28 18<br />
35 to 44 years ................... 3,074 1,294 42 26 54,330 13,105 24 24<br />
45 to 54 years ................... 2,870 1,035 36 21 51,817 12,382 24 23<br />
55 to 64 years ................... 1,852 685 37 14 31,946 8,257 26 15<br />
65 years <strong>and</strong> older ................ 1,186 357 30 7 20,784 5,036 24 9<br />
Sex<br />
Male. .......................... 11,351 4,568 40 93 208,244 51,674 25 95<br />
Female ......................... 1,159 333 29 7 11,681 2,759 24 5<br />
Ethnicity<br />
Hispanic ........................ 424 138 32 3 4,432 1,864 42 3<br />
Non-Hispanic .................... 12,085 4,763 39 97 215,494 52,569 24 97<br />
Race<br />
White .......................... 12,028 4,710 39 96 211,524 52,234 25 96<br />
Black .......................... 194 *33 *17 *1 3,281 *211 *6 *(Z)<br />
Asian .......................... 50 *32 *65 *1 608 *417 *69 *1<br />
All others ....................... 238 125 53 3 4,513 1,570 35 3<br />
Annual Household Income<br />
Less than $10,000 ................ 223 75 34 2 3,766 990 26 2<br />
$10,000 to $19,999. ............... 580 204 35 4 9,134 1,992 22 4<br />
$20,000 to $24,999 ............... 486 136 28 3 9,397 1,742 19 3<br />
$25,000 to $29,999. ............... 567 211 37 4 9,214 2,538 28 5<br />
$30,000 to $34,999 ............... 737 279 38 6 14,270 3,516 25 6<br />
$35,000 to $39,999. ............... 670 239 36 5 12,997 2,315 18 4<br />
$40,000 to $49,999 ............... 1,209 504 42 10 22,075 6,477 29 12<br />
$50,000 to $74,999 ............... 2,754 1,129 41 23 48,999 11,742 24 22<br />
$75,000 to $99,999 ............... 1,739 714 41 15 29,112 7,368 25 14<br />
$100,000 or more ................ 1,977 784 40 16 33,008 8,395 25 15<br />
Not reported. .................... 1,568 626 40 13 27,953 7,356 26 14<br />
Education<br />
11 years or less .................. 1,724 616 36 13 31,126 6,435 21 12<br />
12 years ........................ 4,896 1,846 38 38 93,320 22,212 24 41<br />
1 to 3 years college ............... 3,235 1,341 41 27 56,700 16,334 29 30<br />
4 years college ................... 1,750 697 40 14 26,887 6,165 23 11<br />
5 or more years college ............ 904 400 44 8 11,893 3,287 28 6<br />
* Estimate based on a sample size <strong>of</strong> 10–29. (Z) Less than 0.5 percent.<br />
1 Hunters on public l<strong>and</strong> include those who hunted on both public <strong>and</strong> private l<strong>and</strong>.<br />
2 Days <strong>of</strong> hunting on public l<strong>and</strong> includes both days spent solely on public l<strong>and</strong> <strong>and</strong> those spent on public <strong>and</strong> private l<strong>and</strong>.<br />
Note: Percent <strong>of</strong> total hunters <strong>and</strong> percent <strong>of</strong> total days are based on the total hunters <strong>and</strong> total days columns for each row. Percent <strong>of</strong> hunters using public l<strong>and</strong> <strong>and</strong> percent <strong>of</strong> days on<br />
public l<strong>and</strong> are based on the total number <strong>of</strong> hunters on public l<strong>and</strong> <strong>and</strong> total number <strong>of</strong> days on public l<strong>and</strong>, respectively.<br />
U.S. Fish & <strong>Wildlife</strong> Service <strong>2006</strong> <strong>National</strong> <strong>Survey</strong> <strong>of</strong> <strong>Fishing</strong>, <strong>Hunting</strong>, <strong>and</strong> <strong>Wildlife</strong>-<strong>Associated</strong> Recreation 81