Table C-5. Anglers <strong>and</strong> Hunters by Census Division: 1955 to 1985 (U.S. population 12 years old <strong>and</strong> older. Numbers in thous<strong>and</strong>s) Year Population Sportspersons, fished or hunted Anglers Hunters Number Percent Number Percent Number Percent Number Percent UNITED STATES 1955 ......................... 118,366 100 24,917 21.1 20,813 17.6 11,784 10.0 1960 ......................... 131,226 100 30,435 23.2 25,323 19.3 14,637 11.2 1965 ......................... 141,928 100 32,881 23.2 28,348 20.0 13,585 9.6 1970 ......................... 155,230 100 36,277 23.4 33,158 21.4 14,336 9.2 1975 ......................... 171,860 100 45,773 26.6 41,299 24.0 17,094 9.9 1980 ......................... 184,691 100 46,966 25.4 41,873 22.7 16,758 9.1 1985 ......................... 195,659 100 49,827 25.5 45,345 23.2 16,340 8.4 New Engl<strong>and</strong> 1955 ......................... 7,919 100 1,224 15.4 1,002 12.7 589 7.4 1960 ......................... 8,349 100 1,368 16.4 1,205 14.4 517 6.2 1965 ......................... 9,256 100 1,650 17.8 1,488 16.0 583 6.3 1970 ......................... 8,652 100 1,579 18.3 1,430 16.5 582 6.7 1975 ......................... 9,910 100 2,004 20.2 1,861 18.8 566 5.7 1980 ......................... 10,205 100 1,974 19.3 1,788 17.5 572 5.6 1985 ......................... 10,554 100 2,058 19.5 1,914 18.1 552 5.2 Middle Atlantic 1955 ......................... 24,869 100 3,539 14.2 2,811 11.3 1,608 6.5 1960 ......................... 26,493 100 3,432 13.0 2,569 9.7 1,723 6.5 1965 ......................... 27,346 100 3,602 13.2 2,760 10.1 1,631 6.0 1970 ......................... 28,244 100 4,539 16.1 4,504 14.4 1,731 6.1 1975 ......................... 30,449 100 5,919 19.4 5,097 16.7 2,096 6.9 1980 ......................... 30,256 100 5,181 17.1 4,332 14.3 2,001 6.6 1985 ......................... 31,099 100 5,565 17.9 4,820 15.5 1,972 6.3 East North Central 1955 ......................... 25,733 100 5,489 21.3 4,583 17.8 2,538 9.9 1960 ......................... 26,833 100 6,316 32.5 5,317 19.8 2,985 11.1 1965 ......................... 28,124 100 6,214 22.1 5,336 19.0 2,563 9.1 1970 ......................... 31,550 100 7,284 23.1 6,699 21.2 2,812 8.9 1975 ......................... 32,796 100 9,049 27.6 8,181 24.9 3,392 10.3 1980 ......................... 33,526 100 8,725 26.0 7,891 23.5 2,955 8.8 1985 ......................... 33,747 100 8,973 26.6 8,270 24.5 2,814 8.3 West North Central 1955 ......................... 9,201 100 2,913 31.7 2,346 25.5 1,534 16.7 1960 ......................... 10,149 100 3,383 33.3 2,855 28.1 1,709 16.8 1965 ......................... 11,681 100 3,678 31.5 3,226 27.6 1,620 13.9 1970 ......................... 12,904 100 4,000 31.0 3,579 27.7 1,783 13.8 1975 ......................... 13,564 100 4,524 33.3 4,089 30.1 1,863 13.7 1980 ......................... 13,826 100 4,770 34.5 4,220 30.5 1,965 14.2 1985 ......................... 14,137 100 5,140 36.4 4,681 33.1 1,971 13.9 South Atlantic 1955 ......................... 14,336 100 3,223 22.5 2,805 19.6 1,449 10.1 1960 ......................... 17,798 100 4,423 24.9 3,695 20.8 2,045 11.5 1965 ......................... 20,593 100 5,626 27.3 5,054 24.5 1,900 9.2 1970 ......................... 23,539 100 5,461 23.2 5,129 21.8 1,904 8.1 1975 ......................... 27,127 100 7,110 26.2 6,479 23.9 2,494 9.2 1980 ......................... 30,512 100 7,769 25.5 7,086 23.2 2,444 8.0 1985 ......................... 33,636 100 8,721 25.9 8,056 24.0 2,467 7.3 East South Central 1955 ......................... 7,959 100 1,963 24.7 1,665 20.9 989 12.4 1960 ......................... 9,277 100 2,778 29.9 2,207 23.8 1,510 16.3 1965 ......................... 9,652 100 2,587 26.8 2,201 22.8 1,294 13.4 1970 ......................... 9,862 100 2,660 27.0 2,464 25.0 1,162 11.8 1975 ......................... 10,798 100 3,007 27.8 2,689 24.9 1,355 12.5 1980 ......................... 11,771 100 3,614 30.7 3,173 27.0 1,567 13.3 1985 ......................... 12,364 100 3,671 29.7 3,308 26.8 1,441 11.7 144 <strong>2006</strong> <strong>National</strong> <strong>Survey</strong> <strong>of</strong> <strong>Fishing</strong>, <strong>Hunting</strong>, <strong>and</strong> <strong>Wildlife</strong>-<strong>Associated</strong> Recreation U.S. Fish & <strong>Wildlife</strong> Service
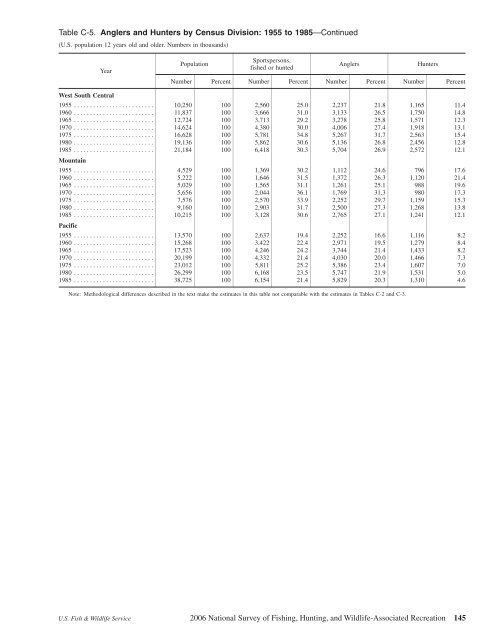
Table C-5. Anglers <strong>and</strong> Hunters by Census Division: 1955 to 1985—Continued (U.S. population 12 years old <strong>and</strong> older. Numbers in thous<strong>and</strong>s) Year Population Sportspersons, fished or hunted Anglers Hunters Number Percent Number Percent Number Percent Number Percent West South Central 1955 ......................... 10,250 100 2,560 25.0 2,237 21.8 1,165 11.4 1960 ......................... 11,837 100 3,666 31.0 3,133 26.5 1,750 14.8 1965 ......................... 12,724 100 3,713 29.2 3,278 25.8 1,571 12.3 1970 ......................... 14,624 100 4,380 30.0 4,006 27.4 1,918 13.1 1975 ......................... 16,628 100 5,781 34.8 5,267 31.7 2,563 15.4 1980 ......................... 19,136 100 5,862 30.6 5,136 26.8 2,456 12.8 1985 ......................... 21,184 100 6,418 30.3 5,704 26.9 2,572 12.1 Mountain 1955 ......................... 4,529 100 1,369 30.2 1,112 24.6 796 17.6 1960 ......................... 5,222 100 1,646 31.5 1,372 26.3 1,120 21.4 1965 ......................... 5,029 100 1,565 31.1 1,261 25.1 988 19.6 1970 ......................... 5,656 100 2,044 36.1 1,769 31.3 980 17.3 1975 ......................... 7,576 100 2,570 33.9 2,252 29.7 1,159 15.3 1980 ......................... 9,160 100 2,903 31.7 2,500 27.3 1,268 13.8 1985 ......................... 10,215 100 3,128 30.6 2,765 27.1 1,241 12.1 Pacific 1955 ......................... 13,570 100 2,637 19.4 2,252 16.6 1,116 8.2 1960 ......................... 15,268 100 3,422 22.4 2,971 19.5 1,279 8.4 1965 ......................... 17,523 100 4,246 24.2 3,744 21.4 1,433 8.2 1970 ......................... 20,199 100 4,332 21.4 4,030 20.0 1,466 7.3 1975 ......................... 23,012 100 5,811 25.2 5,386 23.4 1,607 7.0 1980 ......................... 26,299 100 6,168 23.5 5,747 21.9 1,531 5.0 1985 ......................... 38,725 100 6,154 21.4 5,829 20.3 1,310 4.6 Note: Methodological differences described in the text make the estimates in this table not comparable with the estimates in Tables C-2 <strong>and</strong> C-3. U.S. Fish & <strong>Wildlife</strong> Service <strong>2006</strong> <strong>National</strong> <strong>Survey</strong> <strong>of</strong> <strong>Fishing</strong>, <strong>Hunting</strong>, <strong>and</strong> <strong>Wildlife</strong>-<strong>Associated</strong> Recreation 145
- Page 1 and 2:
U.S. Fish & Wildlife Service 2006 N
- Page 3 and 4:
Economics and Statistics Administra
- Page 5 and 6:
List of Tables Fishing and Hunting:
- Page 7 and 8:
Foreword I find duck hunting with f
- Page 9 and 10:
Highlights
- Page 11 and 12:
wildlife watching. Secondary wildli
- Page 13 and 14:
Expenditures for Wildlife-Related R
- Page 15 and 16:
Fishing
- Page 17 and 18:
Fishing Expenditures Anglers spent
- Page 19 and 20:
special equipment such as boats, va
- Page 21 and 22:
anglers fishing for 20 million days
- Page 23 and 24:
Sex and Age of Anglers Although mor
- Page 25 and 26:
Education, Race, and Ethnicity Peop
- Page 27 and 28:
1996-2006 Fishing Participants, Day
- Page 29 and 30:
Hunting Highlights In 2006, 12.5 mi
- Page 31 and 32:
Big Game Hunting In 2006, a majorit
- Page 33 and 34:
Days per hunter Trips per hunter Co
- Page 35 and 36:
Hunting on Public and Private Lands
- Page 37 and 38:
Large MSA 28% Medium MSA 17% Percen
- Page 39 and 40:
1996-2006 Comparison of Hunting Act
- Page 41 and 42:
Wildlife Watching
- Page 43 and 44:
Wildlife-Watching Expenditures Thir
- Page 45 and 46:
Wildlife Fed, Observed, or Photogra
- Page 47 and 48:
Metropolitan and Nonmetropolitan Ar
- Page 49 and 50:
Education, Race, and Ethnicity of A
- Page 51 and 52:
Away-From-Home Participants by Type
- Page 53 and 54:
Away-From-Home Wildlife Watchers by
- Page 55 and 56:
Metropolitan and Nonmetropolitan Aw
- Page 57 and 58:
1996-2006 Comparison of Wildlife- W
- Page 59 and 60:
2001-2006 Wildlife-Watching Partici
- Page 61 and 62:
Guide to Statistical Tables Purpose
- Page 63 and 64:
Table 3. Freshwater Anglers and Day
- Page 65 and 66:
Table 7. Hunters and Days of Huntin
- Page 67 and 68:
Table 8. Selected Characteristics o
- Page 69 and 70:
Table 9. Selected Characteristics o
- Page 71 and 72:
Table 10. Selected Characteristics
- Page 73 and 74:
Table 12. Expenditures for Fishing:
- Page 75 and 76:
Table 14. Trip and Equipment Expend
- Page 77 and 78:
Table 16. Trip and Equipment Expend
- Page 79 and 80:
Table 18. Trip and Equipment Expend
- Page 81 and 82:
Table 20. Trip and Equipment Expend
- Page 83 and 84:
Table 22. Special Equipment Expendi
- Page 85 and 86:
Table 25. Freshwater Anglers and Da
- Page 87 and 88:
Table 29. Hunters and Days of Hunti
- Page 89 and 90:
Table 32. Boats and Boat Launches U
- Page 91 and 92:
Table 37. Hunters Using Bows and Ar
- Page 93 and 94:
Table 41. Participation in Wildlife
- Page 95 and 96:
Table 44. Expenditures for Wildlife
- Page 97 and 98: Table 45. Selected Characteristics
- Page 99 and 100: Table 46. Selected Characteristics
- Page 101 and 102: Table 50. Participation in Wildlife
- Page 103 and 104: Table 52. Expenditures for Wildlife
- Page 105 and 106: Table 53. Expenditures for Wildlife
- Page 107 and 108: Table 54. Anglers and Hunters by Sp
- Page 109 and 110: Table 56. Hunters by Type of Huntin
- Page 111 and 112: Table 58. Days of Hunting by Type o
- Page 113 and 114: Table 60. Freshwater (Except Great
- Page 115 and 116: Table 63. Days of Fishing by State
- Page 117 and 118: Table 65. Participation in Wildlife
- Page 119 and 120: Table 67. Participation in Away-Fro
- Page 121 and 122: Table 69. Expenditures for Wildlife
- Page 123 and 124: Appendix A. Defi nitions Annual hou
- Page 125 and 126: governments (such as State parks an
- Page 127 and 128: Appendix B. 2005 Participation of 6
- Page 129 and 130: Table B-3. Most Recent Year of Hunt
- Page 131 and 132: Table B-5. Anglers and Hunters 6 to
- Page 133 and 134: Table B-7. Selected Characteristics
- Page 135 and 136: Table B-9. Participants in Wildlife
- Page 137 and 138: Table B-11. Participants in Wildlif
- Page 139 and 140: Appendix C
- Page 141 and 142: Table C-1. Major Characteristics of
- Page 143 and 144: Table C-2. Anglers and Hunters by C
- Page 145 and 146: used most often, distance to boat l
- Page 147: Table C-4. Comparison of Major Find
- Page 151 and 152: Appendix D. Sample Design and Stati
- Page 153 and 154: 1. Base Weight. The base weight is
- Page 155 and 156: Standard Errors of Estimated Number
- Page 157 and 158: Table D-1. Approximate Standard Err
- Page 159 and 160: Table D-3. Approximate Standard Err
- Page 161 and 162: Table D-5. Approximate Standard Err
- Page 163 and 164: Table D-7. Parameters a and b for C
- Page 165 and 166: Table D-9. Parameters a, b, and c f
- Page 167 and 168: Table D-11. Parameters a, b, and c