2006 National Survey of Fishing, Hunting, and Wildlife-Associated ...
2006 National Survey of Fishing, Hunting, and Wildlife-Associated ...
2006 National Survey of Fishing, Hunting, and Wildlife-Associated ...

Create successful ePaper yourself
Turn your PDF publications into a flip-book with our unique Google optimized e-Paper software.
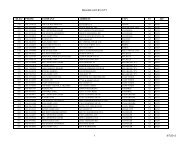
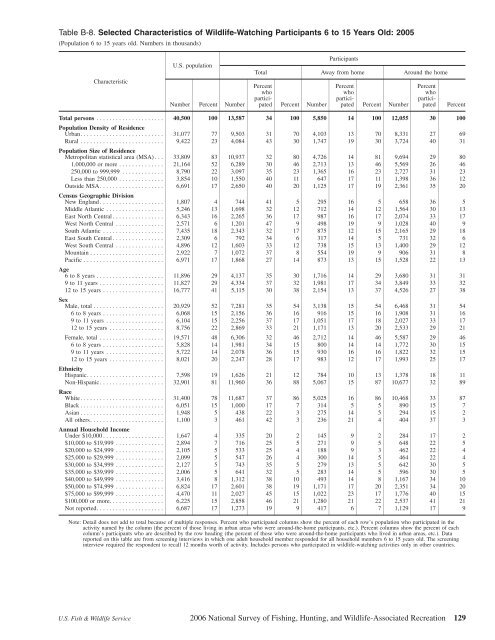
Table B-8. Selected Characteristics <strong>of</strong> <strong>Wildlife</strong>-Watching Participants 6 to 15 Years Old: 2005<br />
(Population 6 to 15 years old. Numbers in thous<strong>and</strong>s)<br />
Characteristic<br />
U.S. population<br />
Number Percent Number<br />
Participants<br />
Total Away from home Around the home<br />
Percent<br />
who<br />
participated<br />
Percent Number<br />
Percent<br />
who<br />
participated<br />
Percent Number<br />
Percent<br />
who<br />
participated<br />
Percent<br />
Total persons ..................... 40,500 100 13,587 34 100 5,850 14 100 12,055 30 100<br />
Population Density <strong>of</strong> Residence<br />
Urban. ......................... 31,077 77 9,503 31 70 4,103 13 70 8,331 27 69<br />
Rural .......................... 9,422 23 4,084 43 30 1,747 19 30 3,724 40 31<br />
Population Size <strong>of</strong> Residence<br />
Metropolitan statistical area (MSA) . . . 33,809 83 10,937 32 80 4,726 14 81 9,694 29 80<br />
1,000,000 or more .............. 21,164 52 6,289 30 46 2,713 13 46 5,569 26 46<br />
250,000 to 999,999 ............. 8,790 22 3,097 35 23 1,365 16 23 2,727 31 23<br />
Less than 250,000 .............. 3,854 10 1,550 40 11 647 17 11 1,398 36 12<br />
Outside MSA. ................... 6,691 17 2,650 40 20 1,125 17 19 2,361 35 20<br />
Census Geographic Division<br />
New Engl<strong>and</strong> .................... 1,807 4 744 41 5 295 16 5 658 36 5<br />
Middle Atlantic .................. 5,246 13 1,698 32 12 712 14 12 1,564 30 13<br />
East North Central ................ 6,343 16 2,265 36 17 987 16 17 2,074 33 17<br />
West North Central ............... 2,571 6 1,201 47 9 498 19 9 1,028 40 9<br />
South Atlantic ................... 7,435 18 2,343 32 17 875 12 15 2,165 29 18<br />
East South Central ................ 2,309 6 792 34 6 317 14 5 731 32 6<br />
West South Central ............... 4,896 12 1,603 33 12 738 15 13 1,400 29 12<br />
Mountain ....................... 2,922 7 1,072 37 8 554 19 9 906 31 8<br />
Pacific ......................... 6,971 17 1,868 27 14 873 13 15 1,528 22 13<br />
Age<br />
6 to 8 years ..................... 11,896 29 4,137 35 30 1,716 14 29 3,680 31 31<br />
9 to 11 years .................... 11,827 29 4,334 37 32 1,981 17 34 3,849 33 32<br />
12to15years................... 16,777 41 5,115 30 38 2,154 13 37 4,526 27 38<br />
Sex<br />
Male, total ...................... 20,929 52 7,281 35 54 3,138 15 54 6,468 31 54<br />
6 to 8 years ................... 6,068 15 2,156 36 16 916 15 16 1,908 31 16<br />
9 to 11 years .................. 6,104 15 2,256 37 17 1,051 17 18 2,027 33 17<br />
12to15years ................. 8,756 22 2,869 33 21 1,171 13 20 2,533 29 21<br />
Female, total .................... 19,571 48 6,306 32 46 2,712 14 46 5,587 29 46<br />
6 to 8 years ................... 5,828 14 1,981 34 15 800 14 14 1,772 30 15<br />
9 to 11 years .................. 5,722 14 2,078 36 15 930 16 16 1,822 32 15<br />
12 to 15 years ................. 8,021 20 2,247 28 17 983 12 17 1,993 25 17<br />
Ethnicity<br />
Hispanic. ....................... 7,598 19 1,626 21 12 784 10 13 1,378 18 11<br />
Non-Hispanic. ................... 32,901 81 11,960 36 88 5,067 15 87 10,677 32 89<br />
Race<br />
White. ......................... 31,400 78 11,687 37 86 5,025 16 86 10,468 33 87<br />
Black .......................... 6,051 15 1,000 17 7 314 5 5 890 15 7<br />
Asian .......................... 1,948 5 438 22 3 275 14 5 294 15 2<br />
All others. ...................... 1,100 3 461 42 3 236 21 4 404 37 3<br />
Annual Household Income<br />
Under $10,000 ................... 1,647 4 335 20 2 145 9 2 284 17 2<br />
$10,000 to $19,999 ............... 2,894 7 716 25 5 271 9 5 648 22 5<br />
$20,000 to $24,999 ............... 2,105 5 533 25 4 188 9 3 462 22 4<br />
$25,000 to $29,999 ............... 2,099 5 547 26 4 300 14 5 464 22 4<br />
$30,000 to $34,999 ............... 2,127 5 743 35 5 279 13 5 642 30 5<br />
$35,000 to $39,999 ............... 2,006 5 641 32 5 283 14 5 596 30 5<br />
$40,000 to $49,999 ............... 3,416 8 1,312 38 10 493 14 8 1,167 34 10<br />
$50,000 to $74,999 ............... 6,824 17 2,601 38 19 1,171 17 20 2,351 34 20<br />
$75,000 to $99,999 ............... 4,470 11 2,027 45 15 1,022 23 17 1,776 40 15<br />
$100,000 or more. ................ 6,225 15 2,858 46 21 1,280 21 22 2,537 41 21<br />
Not reported. .................... 6,687 17 1,273 19 9 417 6 7 1,129 17 9<br />
Note: Detail does not add to total because <strong>of</strong> multiple responses. Percent who participated columns show the percent <strong>of</strong> each row’s population who participated in the<br />
activity named by the column (the percent <strong>of</strong> those living in urban areas who were around-the-home participants, etc.). Percent columns show the percent <strong>of</strong> each<br />
column’s participants who are described by the row heading (the percent <strong>of</strong> those who were around-the-home participants who lived in urban areas, etc.). Data<br />
reported on this table are from screening interviews in which one adult household member responded for all household members 6 to 15 years old. The screening<br />
interview required the respondent to recall 12 months worth <strong>of</strong> activity. Includes persons who participated in wildlife-watching activities only in other countries.<br />
U.S. Fish & <strong>Wildlife</strong> Service <strong>2006</strong> <strong>National</strong> <strong>Survey</strong> <strong>of</strong> <strong>Fishing</strong>, <strong>Hunting</strong>, <strong>and</strong> <strong>Wildlife</strong>-<strong>Associated</strong> Recreation 129