Instability in Indian Agriculture - NCAP
Instability in Indian Agriculture - NCAP
Instability in Indian Agriculture - NCAP
You also want an ePaper? Increase the reach of your titles
YUMPU automatically turns print PDFs into web optimized ePapers that Google loves.
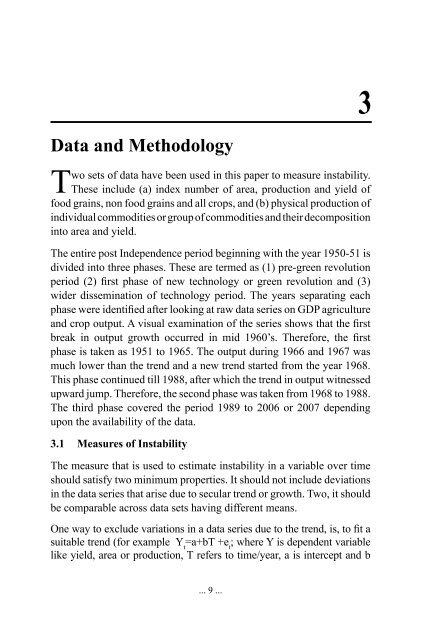
Data and Methodology<br />
Two sets of data have been used <strong>in</strong> this paper to measure <strong>in</strong>stability.<br />
These <strong>in</strong>clude (a) <strong>in</strong>dex number of area, production and yield of<br />
food gra<strong>in</strong>s, non food gra<strong>in</strong>s and all crops, and (b) physical production of<br />
<strong>in</strong>dividual commodities or group of commodities and their decomposition<br />
<strong>in</strong>to area and yield.<br />
The entire post Independence period beg<strong>in</strong>n<strong>in</strong>g with the year 1950-51 is<br />
divided <strong>in</strong>to three phases. These are termed as (1) pre-green revolution<br />
period (2) first phase of new technology or green revolution and (3)<br />
wider dissem<strong>in</strong>ation of technology period. The years separat<strong>in</strong>g each<br />
phase were identified after look<strong>in</strong>g at raw data series on GDP agriculture<br />
and crop output. A visual exam<strong>in</strong>ation of the series shows that the first<br />
break <strong>in</strong> output growth occurred <strong>in</strong> mid 1960’s. Therefore, the first<br />
phase is taken as 1951 to 1965. The output dur<strong>in</strong>g 1966 and 1967 was<br />
much lower than the trend and a new trend started from the year 1968.<br />
This phase cont<strong>in</strong>ued till 1988, after which the trend <strong>in</strong> output witnessed<br />
upward jump. Therefore, the second phase was taken from 1968 to 1988.<br />
The third phase covered the period 1989 to 2006 or 2007 depend<strong>in</strong>g<br />
upon the availability of the data.<br />
3.1 Measures of <strong>Instability</strong><br />
The measure that is used to estimate <strong>in</strong>stability <strong>in</strong> a variable over time<br />
should satisfy two m<strong>in</strong>imum properties. It should not <strong>in</strong>clude deviations<br />
<strong>in</strong> the data series that arise due to secular trend or growth. Two, it should<br />
be comparable across data sets hav<strong>in</strong>g different means.<br />
One way to exclude variations <strong>in</strong> a data series due to the trend, is, to fit a<br />
suitable trend (for example Y t<br />
=a+bT +e t<br />
; where Y is dependent variable<br />
like yield, area or production, T refers to time/year, a is <strong>in</strong>tercept and b<br />
3<br />
... 9 ...


