Instability in Indian Agriculture - NCAP
Instability in Indian Agriculture - NCAP
Instability in Indian Agriculture - NCAP

Create successful ePaper yourself
Turn your PDF publications into a flip-book with our unique Google optimized e-Paper software.
<strong>Instability</strong> <strong>in</strong> <strong>Indian</strong> <strong>Agriculture</strong><br />
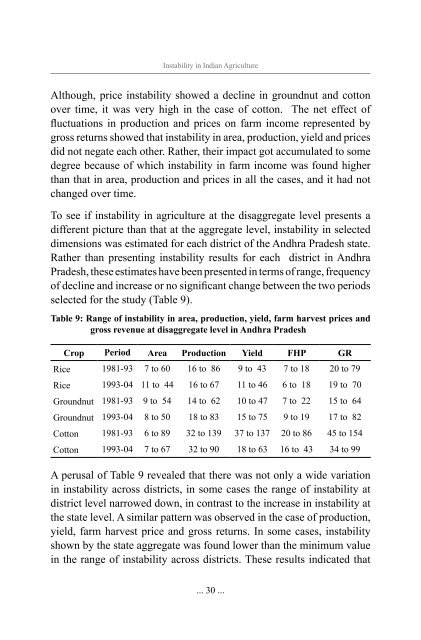
Although, price <strong>in</strong>stability showed a decl<strong>in</strong>e <strong>in</strong> groundnut and cotton<br />
over time, it was very high <strong>in</strong> the case of cotton. The net effect of<br />
fluctuations <strong>in</strong> production and prices on farm <strong>in</strong>come represented by<br />
gross returns showed that <strong>in</strong>stability <strong>in</strong> area, production, yield and prices<br />
did not negate each other. Rather, their impact got accumulated to some<br />
degree because of which <strong>in</strong>stability <strong>in</strong> farm <strong>in</strong>come was found higher<br />
than that <strong>in</strong> area, production and prices <strong>in</strong> all the cases, and it had not<br />
changed over time.<br />
To see if <strong>in</strong>stability <strong>in</strong> agriculture at the disaggregate level presents a<br />
different picture than that at the aggregate level, <strong>in</strong>stability <strong>in</strong> selected<br />
dimensions was estimated for each district of the Andhra Pradesh state.<br />
Rather than present<strong>in</strong>g <strong>in</strong>stability results for each district <strong>in</strong> Andhra<br />
Pradesh, these estimates have been presented <strong>in</strong> terms of range, frequency<br />
of decl<strong>in</strong>e and <strong>in</strong>crease or no significant change between the two periods<br />
selected for the study (Table 9).<br />
Table 9: Range of <strong>in</strong>stability <strong>in</strong> area, production, yield, farm harvest prices and<br />
gross revenue at disaggregate level <strong>in</strong> Andhra Pradesh<br />
Crop Period Area Production Yield FHP GR<br />
Rice 1981-93 7 to 60 16 to 86 9 to 43 7 to 18 20 to 79<br />
Rice 1993-04 11 to 44 16 to 67 11 to 46 6 to 18 19 to 70<br />
Groundnut 1981-93 9 to 54 14 to 62 10 to 47 7 to 22 15 to 64<br />
Groundnut 1993-04 8 to 50 18 to 83 15 to 75 9 to 19 17 to 82<br />
Cotton 1981-93 6 to 89 32 to 139 37 to 137 20 to 86 45 to 154<br />
Cotton 1993-04 7 to 67 32 to 90 18 to 63 16 to 43 34 to 99<br />
A perusal of Table 9 revealed that there was not only a wide variation<br />
<strong>in</strong> <strong>in</strong>stability across districts, <strong>in</strong> some cases the range of <strong>in</strong>stability at<br />
district level narrowed down, <strong>in</strong> contrast to the <strong>in</strong>crease <strong>in</strong> <strong>in</strong>stability at<br />
the state level. A similar pattern was observed <strong>in</strong> the case of production,<br />
yield, farm harvest price and gross returns. In some cases, <strong>in</strong>stability<br />
shown by the state aggregate was found lower than the m<strong>in</strong>imum value<br />
<strong>in</strong> the range of <strong>in</strong>stability across districts. These results <strong>in</strong>dicated that<br />
... 30 ...