Instability in Indian Agriculture - NCAP
Instability in Indian Agriculture - NCAP
Instability in Indian Agriculture - NCAP

You also want an ePaper? Increase the reach of your titles
YUMPU automatically turns print PDFs into web optimized ePapers that Google loves.
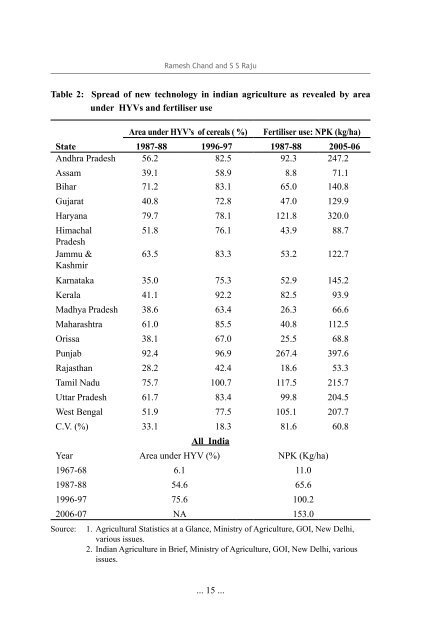
Ramesh Chand and S S Raju<br />
Table 2: Spread of new technology <strong>in</strong> <strong>in</strong>dian agriculture as revealed by area<br />
under HYVs and fertiliser use<br />
Area under HYV’s of cereals ( %)<br />
Fertiliser use: NPK (kg/ha)<br />
State 1987-88 1996-97 1987-88 2005-06<br />
Andhra Pradesh 56.2 82.5 92.3 247.2<br />
Assam 39.1 58.9 8.8 71.1<br />
Bihar 71.2 83.1 65.0 140.8<br />
Gujarat 40.8 72.8 47.0 129.9<br />
Haryana 79.7 78.1 121.8 320.0<br />
Himachal<br />
51.8 76.1 43.9 88.7<br />
Pradesh<br />
Jammu &<br />
63.5 83.3 53.2 122.7<br />
Kashmir<br />
Karnataka 35.0 75.3 52.9 145.2<br />
Kerala 41.1 92.2 82.5 93.9<br />
Madhya Pradesh 38.6 63.4 26.3 66.6<br />
Maharashtra 61.0 85.5 40.8 112.5<br />
Orissa 38.1 67.0 25.5 68.8<br />
Punjab 92.4 96.9 267.4 397.6<br />
Rajasthan 28.2 42.4 18.6 53.3<br />
Tamil Nadu 75.7 100.7 117.5 215.7<br />
Uttar Pradesh 61.7 83.4 99.8 204.5<br />
West Bengal 51.9 77.5 105.1 207.7<br />
C.V. (%) 33.1 18.3 81.6 60.8<br />
All India<br />
Year Area under HYV (%) NPK (Kg/ha)<br />
1967-68 6.1 11.0<br />
1987-88 54.6 65.6<br />
1996-97 75.6 100.2<br />
2006-07 NA 153.0<br />
Source: 1. Agricultural Statistics at a Glance, M<strong>in</strong>istry of <strong>Agriculture</strong>, GOI, New Delhi,<br />
various issues.<br />
2. <strong>Indian</strong> <strong>Agriculture</strong> <strong>in</strong> Brief, M<strong>in</strong>istry of <strong>Agriculture</strong>, GOI, New Delhi, various<br />
issues.<br />
... 15 ...