Instability in Indian Agriculture - NCAP
Instability in Indian Agriculture - NCAP
Instability in Indian Agriculture - NCAP

You also want an ePaper? Increase the reach of your titles
YUMPU automatically turns print PDFs into web optimized ePapers that Google loves.
Ramesh Chand and S S Raju<br />
high as 47 per cent <strong>in</strong> terms of standard deviation from trend. Among the<br />
three crops, rice production showed lowest year- to- year fluctuations.<br />
Beside fluctuations <strong>in</strong> production, prices received by the farmers for<br />
their produce are equally important <strong>in</strong> caus<strong>in</strong>g variations <strong>in</strong> farm <strong>in</strong>come.<br />
Therefore, it is important to consider fluctuations <strong>in</strong> farm <strong>in</strong>come to<br />
understand and address risk <strong>in</strong> this <strong>in</strong>come. It is important to po<strong>in</strong>t out<br />
that farm harvest prices showed much lower fluctuations than those <strong>in</strong><br />
yield and production. Second, <strong>in</strong>stability <strong>in</strong> farm harvest prices showed<br />
a decl<strong>in</strong>e over time <strong>in</strong> the case of groundnut and cotton and small<br />
<strong>in</strong>crease <strong>in</strong> the case of rice. Among the three crops, farm harvest prices<br />
of rice showed the lowest <strong>in</strong>stability, 8.3 per cent. The decl<strong>in</strong>e <strong>in</strong> price<br />
fluctuations <strong>in</strong> groundnut and cotton after 1993 seems to be the result<br />
of <strong>in</strong>creased <strong>in</strong>tegration and improvements <strong>in</strong> agricultural markets <strong>in</strong><br />
the country. The reason for small <strong>in</strong>crease <strong>in</strong> price <strong>in</strong>stability of rice<br />
seems to be the result of liberalization of rice trade after 1995, which<br />
was earlier very tightly regulated by the government.<br />
Generally, prices and production are expected to have negative co-variance<br />
as <strong>in</strong>crease <strong>in</strong> production puts downward pressure on price and a decrease<br />
<strong>in</strong> production should result <strong>in</strong> an <strong>in</strong>crease <strong>in</strong> price. It is generally expected to<br />
have a smoothen<strong>in</strong>g effect on gross return from a crop. But, this expectation<br />
is met if negative covariance <strong>in</strong> fluctuations between farm harvest prices<br />
and production exceeds variance of either price or production.<br />
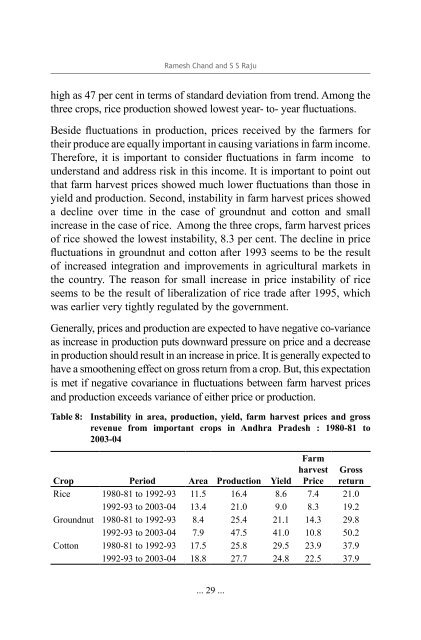
Table 8: <strong>Instability</strong> <strong>in</strong> area, production, yield, farm harvest prices and gross<br />
revenue from important crops <strong>in</strong> Andhra Pradesh : 1980-81 to<br />
2003-04<br />
Farm<br />
harvest<br />
Price<br />
Gross<br />
return<br />
Crop Period Area Production Yield<br />
Rice 1980-81 to 1992-93 11.5 16.4 8.6 7.4 21.0<br />
1992-93 to 2003-04 13.4 21.0 9.0 8.3 19.2<br />
Groundnut 1980-81 to 1992-93 8.4 25.4 21.1 14.3 29.8<br />
1992-93 to 2003-04 7.9 47.5 41.0 10.8 50.2<br />
Cotton 1980-81 to 1992-93 17.5 25.8 29.5 23.9 37.9<br />
1992-93 to 2003-04 18.8 27.7 24.8 22.5 37.9<br />
... 29 ...