Instability in Indian Agriculture - NCAP
Instability in Indian Agriculture - NCAP
Instability in Indian Agriculture - NCAP

Create successful ePaper yourself
Turn your PDF publications into a flip-book with our unique Google optimized e-Paper software.
Ramesh Chand and S S Raju<br />
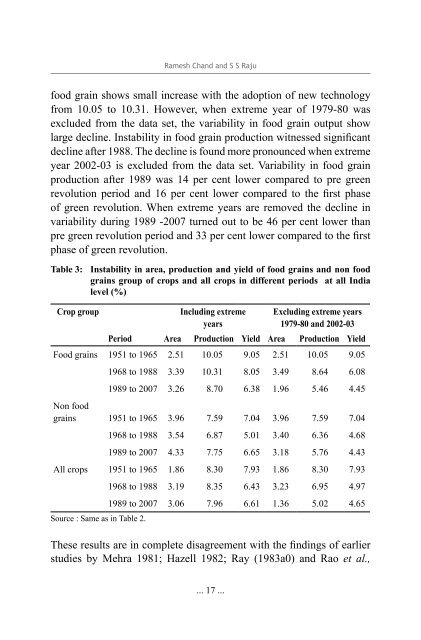
food gra<strong>in</strong> shows small <strong>in</strong>crease with the adoption of new technology<br />
from 10.05 to 10.31. However, when extreme year of 1979-80 was<br />
excluded from the data set, the variability <strong>in</strong> food gra<strong>in</strong> output show<br />
large decl<strong>in</strong>e. <strong>Instability</strong> <strong>in</strong> food gra<strong>in</strong> production witnessed significant<br />
decl<strong>in</strong>e after 1988. The decl<strong>in</strong>e is found more pronounced when extreme<br />
year 2002-03 is excluded from the data set. Variability <strong>in</strong> food gra<strong>in</strong><br />
production after 1989 was 14 per cent lower compared to pre green<br />
revolution period and 16 per cent lower compared to the first phase<br />
of green revolution. When extreme years are removed the decl<strong>in</strong>e <strong>in</strong><br />
variability dur<strong>in</strong>g 1989 -2007 turned out to be 46 per cent lower than<br />
pre green revolution period and 33 per cent lower compared to the first<br />
phase of green revolution.<br />
Table 3: <strong>Instability</strong> <strong>in</strong> area, production and yield of food gra<strong>in</strong>s and non food<br />
gra<strong>in</strong>s group of crops and all crops <strong>in</strong> different periods at all India<br />
level (%)<br />
Crop group<br />
Includ<strong>in</strong>g extreme<br />
years<br />
Exclud<strong>in</strong>g extreme years<br />
1979-80 and 2002-03<br />
Period Area Production Yield Area Production Yield<br />
Food gra<strong>in</strong>s 1951 to 1965 2.51 10.05 9.05 2.51 10.05 9.05<br />
1968 to 1988 3.39 10.31 8.05 3.49 8.64 6.08<br />
1989 to 2007 3.26 8.70 6.38 1.96 5.46 4.45<br />
Non food<br />
gra<strong>in</strong>s 1951 to 1965 3.96 7.59 7.04 3.96 7.59 7.04<br />
1968 to 1988 3.54 6.87 5.01 3.40 6.36 4.68<br />
1989 to 2007 4.33 7.75 6.65 3.18 5.76 4.43<br />
All crops 1951 to 1965 1.86 8.30 7.93 1.86 8.30 7.93<br />
1968 to 1988 3.19 8.35 6.43 3.23 6.95 4.97<br />
1989 to 2007 3.06 7.96 6.61 1.36 5.02 4.65<br />
Source : Same as <strong>in</strong> Table 2.<br />
These results are <strong>in</strong> complete disagreement with the f<strong>in</strong>d<strong>in</strong>gs of earlier<br />
studies by Mehra 1981; Hazell 1982; Ray (1983a0) and Rao et al.,<br />
... 17 ...