Instability in Indian Agriculture - NCAP
Instability in Indian Agriculture - NCAP
Instability in Indian Agriculture - NCAP

Create successful ePaper yourself
Turn your PDF publications into a flip-book with our unique Google optimized e-Paper software.
<strong>Instability</strong> <strong>in</strong> <strong>Indian</strong> <strong>Agriculture</strong><br />
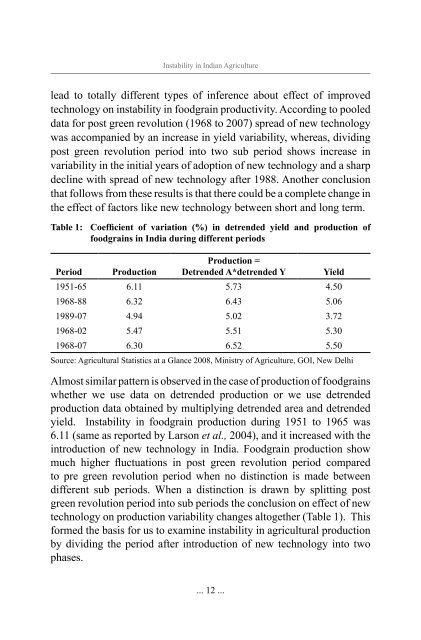
lead to totally different types of <strong>in</strong>ference about effect of improved<br />
technology on <strong>in</strong>stability <strong>in</strong> foodgra<strong>in</strong> productivity. Accord<strong>in</strong>g to pooled<br />
data for post green revolution (1968 to 2007) spread of new technology<br />
was accompanied by an <strong>in</strong>crease <strong>in</strong> yield variability, whereas, divid<strong>in</strong>g<br />
post green revolution period <strong>in</strong>to two sub period shows <strong>in</strong>crease <strong>in</strong><br />
variability <strong>in</strong> the <strong>in</strong>itial years of adoption of new technology and a sharp<br />
decl<strong>in</strong>e with spread of new technology after 1988. Another conclusion<br />
that follows from these results is that there could be a complete change <strong>in</strong><br />
the effect of factors like new technology between short and long term.<br />
Table 1: Coefficient of variation (%) <strong>in</strong> detrended yield and production of<br />
foodgra<strong>in</strong>s <strong>in</strong> India dur<strong>in</strong>g different periods<br />
Period<br />
Production<br />
Production =<br />
Detrended A*detrended Y<br />
Yield<br />
1951-65 6.11 5.73 4.50<br />
1968-88 6.32 6.43 5.06<br />
1989-07 4.94 5.02 3.72<br />
1968-02 5.47 5.51 5.30<br />
1968-07 6.30 6.52 5.50<br />
Source: Agricultural Statistics at a Glance 2008, M<strong>in</strong>istry of <strong>Agriculture</strong>, GOI, New Delhi<br />
Almost similar pattern is observed <strong>in</strong> the case of production of foodgra<strong>in</strong>s<br />
whether we use data on detrended production or we use detrended<br />
production data obta<strong>in</strong>ed by multiply<strong>in</strong>g detrended area and detrended<br />
yield. <strong>Instability</strong> <strong>in</strong> foodgra<strong>in</strong> production dur<strong>in</strong>g 1951 to 1965 was<br />
6.11 (same as reported by Larson et al., 2004), and it <strong>in</strong>creased with the<br />
<strong>in</strong>troduction of new technology <strong>in</strong> India. Foodgra<strong>in</strong> production show<br />
much higher fluctuations <strong>in</strong> post green revolution period compared<br />
to pre green revolution period when no dist<strong>in</strong>ction is made between<br />
different sub periods. When a dist<strong>in</strong>ction is drawn by splitt<strong>in</strong>g post<br />
green revolution period <strong>in</strong>to sub periods the conclusion on effect of new<br />
technology on production variability changes altogether (Table 1). This<br />
formed the basis for us to exam<strong>in</strong>e <strong>in</strong>stability <strong>in</strong> agricultural production<br />
by divid<strong>in</strong>g the period after <strong>in</strong>troduction of new technology <strong>in</strong>to two<br />
phases.<br />
... 12 ...