Instability in Indian Agriculture - NCAP
Instability in Indian Agriculture - NCAP
Instability in Indian Agriculture - NCAP

Create successful ePaper yourself
Turn your PDF publications into a flip-book with our unique Google optimized e-Paper software.
Ramesh Chand and S S Raju<br />
Table 7: Average ra<strong>in</strong>fall and its variability <strong>in</strong> different periods:<br />
All India level<br />
Period<br />
Average<br />
Ra<strong>in</strong>fall cms.<br />
Standard deviation <strong>in</strong> the<br />
annual ra<strong>in</strong>fall: cms<br />
1950-51 to 1964/65 112.5 10.7<br />
1967-68 to 1987-88 107.2 12.5<br />
1988-89 to 2005-06 115.4 9.6<br />
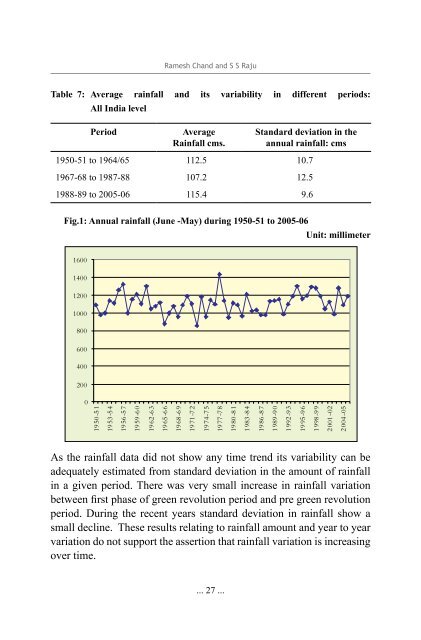
Fig.1: Annual ra<strong>in</strong>fall (June -May) dur<strong>in</strong>g 1950-51 to 2005-06<br />
Unit: millimeter<br />
As the ra<strong>in</strong>fall data did not show any time trend its variability can be<br />
adequately estimated from standard deviation <strong>in</strong> the amount of ra<strong>in</strong>fall<br />
<strong>in</strong> a given period. There was very small <strong>in</strong>crease <strong>in</strong> ra<strong>in</strong>fall variation<br />
between first phase of green revolution period and pre green revolution<br />
period. Dur<strong>in</strong>g the recent years standard deviation <strong>in</strong> ra<strong>in</strong>fall show a<br />
small decl<strong>in</strong>e. These results relat<strong>in</strong>g to ra<strong>in</strong>fall amount and year to year<br />
variation do not support the assertion that ra<strong>in</strong>fall variation is <strong>in</strong>creas<strong>in</strong>g<br />
over time.<br />
... 27 ...